Affiliate Disclosure: This post contains AliExpress affiliate links. If you make a purchase through these links, the author may receive a commission.
Table of Contents
- 1. Two Attempts for Faster Inference
- 2. Reducing Denoising Time by 18.48% with FFN Quantization
- 3. Faster Execution, but Below Quality Standards
- 4. Time Reductions Possible by Keeping Models in Memory
- 5. Memory Limits Revealed at 18 Contexts
- 6. Can a Small LRU Cache Solve the Problem?
- 7. Configuration Maintained on 8GB
1. Two Attempts for Faster Inference
After executing Anima inference on the ROCK 5C 8GB, we compared two optimizations: FFN quantization and resident model contexts. The board is equipped with an RK3588S2, and experiments were conducted in 2026-8 in the RKNN-Toolkit2 2.3.2 environment.
We used the same 84-model FP16 RKNN partitioned configuration as in Part 1 as our baseline. The NPU processes attention and FFN, while the CPU handles AdaLN and FP32 residual accumulation. The questions addressed here are whether we can accelerate computation or reduce the repetitive model staging overhead.
The architecture of sequentially executing 84 subgraphs at a fixed 512×512 resolution introduces inherent overhead from loading, initializing, and releasing models at every step. Accordingly, we established two core hypotheses for system optimization: 1. Compute Acceleration Hypothesis: Apply W8A8 integer quantization to the computationally heavy FFN layers to shorten NPU execution time. 2. Lifecycle Reduction Hypothesis: Keep the runtime contexts of all 84 RKNN models resident in memory (Resident Context) to eliminate repetitive loading and initialization time at each step.
Empirically testing these two approaches on the ROCK 5C 8GB revealed concrete bottlenecks: image quality degradation and physical memory limits.
2. Reducing Denoising Time by 18.48% with FFN Quantization
We applied integer quantization to the FFN (Feed-Forward Network) regions of the 28 blocks where compute is concentrated, out of the total 84 RKNN subgraphs in the DiT. We adopted a hybrid build approach: weights and activations of the Linear(2048→8192) and Linear(8192→2048) layers inside the FFN were quantized to INT8 (W8A8), while the non-linear GELU activation and branch output sections were maintained in FP16. The self-attention and cross-attention cores retained their existing FP16 configuration, and the host-side residual stream also preserved FP32 precision.
For quantization calibration, we used activation tensors collected during the baseline FP16 denoising process. Combining high/low sigma steps and conditional/unconditional CFG branches, we collected 4 sets per block for a total of 112 sets. All 28 FFN blocks were successfully converted.
Under identical conditions—same initial latent (seed: 20260812), prompt context, CFG scale of 4.0, and 20 steps—the comparative benchmark results are as follows.
| Metric | Baseline FP16 | FFN Linear W8A8 | Delta |
|---|---|---|---|
| 20-Step Denoise Time | 2,408.54 seconds | 1,963.45 seconds | Reduced by 445.09 seconds (18.48% improvement) |
| Average Time per Step | 120.40 seconds | 98.15 seconds | Reduced by 22.25 seconds |
| Average FFN Core Execution per Step | 44.76 seconds | 23.57 seconds | 1.90× speedup |
| Average Self Core Execution per Step | 24.00 seconds | 25.74 seconds | Run-to-run variance level |
| Average Cross Core Execution per Step | 7.45 seconds | 7.69 seconds | Run-to-run variance level |
Overall denoising became 1.227× faster, and the quantized FFN section accelerated by 1.90×. No NaNs or Infs occurred during execution.
3. Faster Execution, but Below Quality Standards
Although denoising time decreased by 18.48%, the resulting 512×512 image after VAE decoding failed to meet visual quality criteria.
Numerical stability without divergence was a separate matter from sufficient image quality. While this W8A8 configuration maintained numerical stability, it failed the image quality threshold.
Therefore, we did not adopt FFN quantization and reverted to the FP16 configuration. Optimization of generative models must evaluate final image quality alongside execution latency.
4. Time Reductions Possible by Keeping Models in Memory
To reduce inference latency without degrading image quality, the next hypothesis evaluated was runtime model residency (Resident Context), which eliminates the loading and initialization overhead across the 84 subgraphs.
The partitioned configuration loads each model, initializes the runtime, executes inference, and then releases it. The average preparation and teardown overhead across a single pass through all 84 models, measured over 3 runs, is as follows.
| Lifecycle Stage | Elapsed Time for 1 Pass Across 84 Models (Average) | Notes |
|---|---|---|
load_rknn |
13.96 seconds | Load model weights into host memory |
init_runtime |
12.90 seconds | Create NPU driver context and establish DMA mappings |
release |
4.84 seconds | Tear down NPU runtime and device mappings |
| Pure Stage Sum | 31.71 seconds | Wall-clock time including loop overhead: 33.84 seconds |
The average lifecycle latency per model across branches was 0.423 seconds for self-attention, 0.200 seconds for cross-attention, and 0.510 seconds for FFN.
Under the operating conditions of the 28-step Spectrum sampler, 15 out of the total 28 steps are replaced by extrapolation/prediction, meaning actual NPU operations take place across 13 compute steps. Consequently, when generating 1 image, the total number of lifecycle invocations is 84 models × 13 steps = 1,092 invocations, and cumulative pure lifecycle latency reaches approximately 412.2 seconds.
If keeping all 84 contexts permanently resident in memory were possible, one could theoretically eliminate the lifecycle overhead for the remaining 12 passes—excluding the initial 1 setup (load/init) and final 1 teardown (release) operations totaling 31.71 seconds.
\[\Delta T_{\text{theoretical}} = 31.708\,\text{s} \times (13 – 1) = 380.50\,\text{s} \approx 6.34\,\text{분}\]According to this calculation, overall generation time could theoretically be reduced from an average of 28.56 minutes (1,713.78 seconds) down to 22.22 minutes (1,333.28 seconds). However, this figure is strictly a theoretical upper bound derived under the premise that keeping 84 contexts resident is physically viable, and does not represent measured or achieved performance in an actual resident denoising pipeline.
5. Memory Limits Revealed at 18 Contexts
We incrementally loaded models into memory one by one, measuring actual memory footprint and swap growth. This experiment was conducted to verify whether an 8GB environment could handle full residency before attempting to execute it.
Safety abort criteria for the benchmark were defined as available memory (MemAvailable) falling below 1.5 GiB or system swap usage exceeding 16 MiB. Incrementally loading contexts starting from 1 yielded the following results.
| Resident Context Count | Process Absolute PSS | Additional PSS vs. Baseline | MemAvailable Delta | System Swap Growth |
|---|---|---|---|---|
| 1 | 365.4 MiB | 154.9 MiB | -151.8 MiB | 0 MiB |
| 4 | 765.6 MiB | 555.1 MiB | -558.5 MiB | 0 MiB |
| 8 | 1,262.6 MiB | 1,052.1 MiB | -1,000.3 MiB | 1.3 MiB |
| 12 | 1,823.3 MiB | 1,612.8 MiB | -1,567.6 MiB | 5.0 MiB |
| 16 | 2,354.9 MiB | 2,144.4 MiB | -2,104.2 MiB | 9.0 MiB |
| 18 | 2,631.4 MiB | 2,420.9 MiB | -2,372.5 MiB | 21.4 MiB (Aborted) |
Upon loading context 18, the absolute process PSS reached approximately 2.57 GiB (2,631.4 MiB), recording an additional PSS over baseline of approximately 2.36 GiB (2,420.9 MiB). System swap increased by 21.4 MiB relative to baseline, triggering early benchmark abortion per safety limits (exceeding 16 MiB). All 18 loaded contexts were immediately and safely released (release wall time: 1.05 seconds), reclaiming device mappings.
Memory growth occurred not only in host tensors but also in NPU driver device mappings. When sustaining 16 contexts, device mappings accounted for approximately 1.357 GiB, and system swap increased by 19.5 MiB during an 30-second dwell period.
Linearly extrapolating total resource requirements for all 84 models based on measured memory growth across 16~18 contexts yields the following projections: – Projected device mapping memory: approximately 7.1 GiB – Projected process total additional PSS: approximately 11.3 GiB
Total physical RAM on the ROCK 5C board is 7.75 GiB. Even before accounting for baseline OS overhead, CPU host-side weights and compute buffers (approx. 0.8~1.0 GiB), and residency space for the prompt encoder and VAE decoder, an additional PSS requirement of 11.3 GiB exceeds hardware limits. Therefore, concurrent residency across all 84 subgraphs fails the memory gate.
6. Can a Small LRU Cache Solve the Problem?
If full residency of all 84 models is impossible, one might consider operating a limited context pool of around 4~16 models under an LRU (Least Recently Used) policy, or pinning a select subset of models in memory.
In fresh standalone processes, allocating pools of 4, 8, 12, and 16 contexts yielded measured additional PSS memory footprints of 554.8 MiB (approx. 0.54 GiB), 1,046.1 MiB (approx. 1.02 GiB), 1,621.5 MiB (approx. 1.58 GiB), and 2,185.4 MiB (approx. 2.13 GiB), respectively.
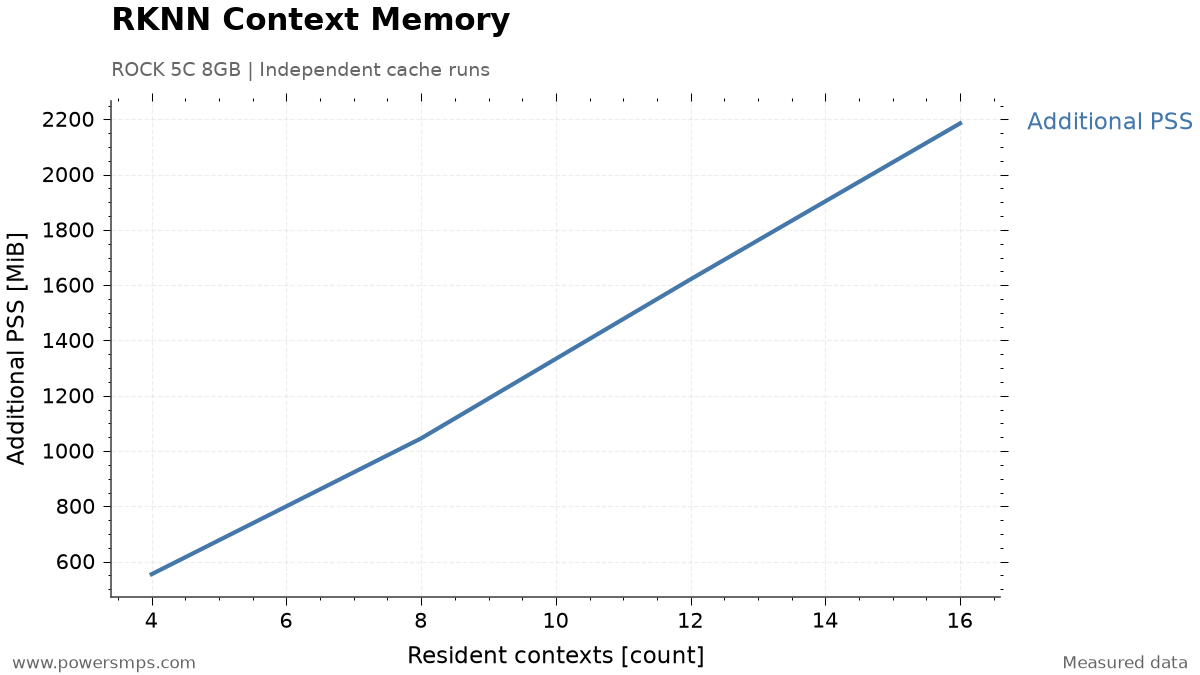
While additional PSS broadly exhibits an upward trend as contexts increase, the relationship is not strictly linear. Furthermore, this limited caching strategy loses practical utility due to the forward execution structure of the DiT.
Sequential invocation sequence for step n (total 84 models)
[Model 00 (self) → Model 01 (cross) → Model 02 (FFN) → ... → Model 83 (FFN)]
  ↓ Residual connection accumulation and scheduler latent update
Sequential invocation sequence for step n+1 (identical pass across all 84 models)
[Model 00 (self) → Model 01 (cross) → Model 02 (FFN) → ... → Model 83 (FFN)]
Each branch output in a DiT block is immediately summed into the host’s FP32 residual stream and fed as input to subsequent branches and blocks. Furthermore, only after all 84 branch operations complete can the sampler update the denoising latent representation and advance to the next diffusion step. That is, loop interchange to reorder invocations is impossible due to sequential dependencies between models.
Structurally, all 84 models are cyclically referenced in fixed order 1 times per 1 step. Before the same model can be re-invoked, 83 other models must be evaluated. Therefore, under any standard LRU cache with capacity strictly below 84 (e.g., capacity 4, 8, 16, 28, 56, etc.), every loaded model is inevitably evicted just before it could ever be reused: – LRU simulation result: across a total of 1,092 invocations, 0 hits / 1,092 misses (0% cache hit rate)
Even if static pinning were applied to keep select models (e.g., model 0~15) in memory without eviction, the maximum time savable across 16 models amounts to only 16 model’s lifecycle per compute step. For 1 image, this reaches an absolute theoretical maximum savings of only approximately 72.4 seconds—which is not an empirically verified measurement. In return, the price paid is an additional PSS overhead of 2.13 GiB (2,185.4 MiB) and swap churn during sustained retention. Sacrificing system stability and inducing swap jitter for a modest theoretical saving of 72.4 seconds represents an unsound engineering trade-off.
7. Configuration Maintained on 8GB
The core bottlenecks and empirical findings derived from the W8A8 FFN integer quantization and resident context cache experiments are summarized below:
- FFN W8A8 quantization: Computation accelerated, but fell short of visual quality standards.
- Full model residency: Swap activity increased at 18 contexts, and additional PSS for 84 resident models extrapolated to approximately 11.3 GiB.
- Limited caching: Under cyclic invocations, models were evicted before reuse, yielding zero LRU cache hits.
On the ROCK 5C 8GB, we retained the FP16 models and chose an on-demand strategy: staging and executing each required model sequentially, followed immediately by release. In this comparison, the memory penalty far outweighed the latency benefits of keeping models resident.
This decision applies specifically to this 8GB board and partitioned configuration. If memory capacity or model partitioning strategies change, the trade-offs of residency must be re-evaluated.
Instead of stacking models in memory, can the graph partitioned into 84 subgraphs be consolidated into fewer models? In Part 4, we upgrade the compiler version to attempt graph operator fusion and compare latency and memory trade-offs.