Tag: Buck Converter

  • Coil and Inductor Basics: Understanding Current Change and Stored Energy

    Coil and Inductor Basics: Understanding Current Change and Stored Energy

    The high voltage generated when interrupting current through a coil and the principle by which a buck converter maintains load current while repeatedly switching are fundamentally identical. Both phenomena can be explained by the inductor’s core characteristics: generating a voltage in response to changes in current, and storing energy in its magnetic field.

    A coil refers to a structure of wound wire, whereas an inductor is a circuit component that utilizes the inductance of that structure. A relay coil uses magnetic force to actuate mechanical contacts, while a power inductor transfers energy and controls current ripple throughout the switching cycle. This article connects both applications through fundamental equations.

    1. How Does an Inductor Oppose Current Change?

    The unit of inductance \(L\) is the henry (H), with mH and µH also widely used in circuits. An ideal inductor with constant inductance obeys the following relationship:

    \[v_L=L\frac{di}{dt}\]

    This equation applies the passive sign convention, where the terminal into which current enters is defined as positive (+). For a given applied voltage, a larger \(L\) results in a smaller rate of current change \(di/dt\). When the voltage is positive, the current increases; when negative, the current decreases. In this model with finite applied voltages, current cannot jump instantaneously to a different value.

    In electromagnetism literature, the induced electromotive force (EMF) from self-induction is often written as \(\varepsilon=-L\,di/dt\). The negative sign signifies that the induced EMF has a polarity opposing the change in current. In circuit theory under the passive sign convention, the terminal where current enters is defined as positive (+), yielding a terminal voltage of \(v_L=-\varepsilon=L\,di/dt\). When the reference directions for terminal voltage and induced EMF are properly distinguished, the two expressions are fully consistent.

    In DC steady state, the current is constant so \(di/dt=0\), and the voltage across an ideal inductor is 0V. In a practical inductor, the winding DC resistance (DCR) causes a voltage drop of \(I\times\mathrm{DCR}\) and a power loss of \(I^2\times\mathrm{DCR}\). It is essential to distinguish the transient current change before reaching steady state from the resistive loss after reaching it.

    2. How Much Energy Is Stored in the Magnetic Field?

    In a linear model with constant inductance, the stored energy is expressed as follows:

    \[E=\frac{1}{2}LI^2\]

    This is obtained by integrating \(p=v_Li\). For a constant inductance, doubling the current quadruples the stored energy. In regions where core saturation causes \(L\) to vary significantly with current, this equation with constant \(L\) cannot be directly applied.

    As an educational example, substituting \(L=10\,\mathrm{mH}\) and \(I=0.1\,\mathrm{A}\) yields the following:

    \[E=\frac{1}{2}\times0.01\times0.1^2=50\,\mu\mathrm{J}\]

    This calculation is based on an idealized linear model; when the switch turns off, this energy does not vanish, but is instead transferred to another path or dissipated as heat across resistance and protective components.

    3. Relay Back EMF and Flyback Diodes

    Consider driving a DC relay with a low-side MOSFET. When the switch turns ON, current flows along the path: Supply → Coil Top → Coil Bottom → MOSFET → GND. Once fully settled, the current is determined by factors including the supply voltage and coil resistance.
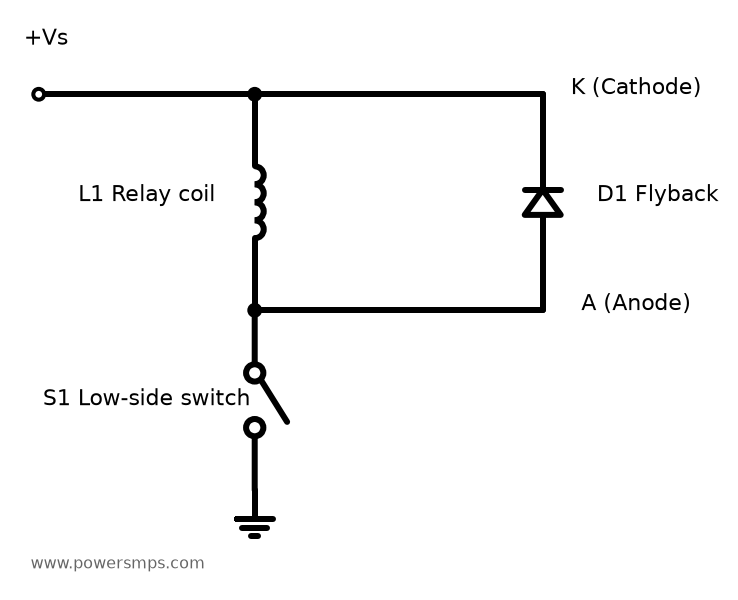
    Schematic of a DC relay coil with a parallel flyback diode. S1 is an idealized low-side switch representing the MOSFET driver; gate drive circuitry and relay contacts are omitted.
    Schematic of a DC relay coil with a parallel flyback diode. S1 is an idealized low-side switch representing the MOSFET driver; gate drive circuitry and relay contacts are omitted.

    When the switch turns OFF, the path through the MOSFET is interrupted, but the coil current cannot instantly drop to 0. The coil reverses its voltage polarity to maintain the existing current direction. In low-side drive where the coil top is tied to the supply, the bottom node—the drain—can rise well above the supply voltage. Without an adequate protection path, this overvoltage can exceed the switch ratings and cause damage. The peak voltage and damage risk depend on stored energy, parasitic components, and device avalanche ratings.

    Diode Orientation and OFF Current Path

    A flyback diode is connected in parallel with the coil:

    • Cathode (K): Connected to the positive (+) supply at the top of the coil. This corresponds to the banded side of a typical diode package.
    • Anode (A): Connected to the bottom of the coil and the switch drain node.

    While the switch is ON, the diode is reverse-biased. After the switch turns OFF, the rising voltage at the bottom of the coil forward-biases the diode, establishing a circulating freewheeling loop: Coil Top → Coil Bottom → Diode Anode → Cathode → Coil Top. Current within the coil does not suddenly reverse direction.

    In a simplified model excluding overshoot caused by trace parasitics, the drain voltage relative to ground is clamped to approximately:

    \[V_{\mathrm{drain}}\approx V_s+V_F\]

    Here, \(V_F\) is the forward voltage of the diode at the operating current and temperature. In practical circuits, transient voltage overshoot from layout parasitic inductance can add to this value; therefore, both the peak drain voltage and the MOSFET voltage rating margin must be verified alongside this approximation.

    Why Does Adding a Diode Delay Relay Release?

    A lower clamping voltage reduces switch voltage stress, but extends the time required for current to decay. Modeling the coil as a series combination of constant inductance \(L\) and winding resistance \(R\), and approximating diode forward drop during conduction as \(V_F\), yields the following equations:

    \[L\frac{di}{dt}+Ri=-V_F\] \[\frac{di}{dt}=-\frac{Ri+V_F}{L}\]

    The total top-to-bottom coil terminal voltage is approximately \(-V_F\), while the voltage across the ideal inductance element alone is \(-(Ri+V_F)\). Only when winding resistance is neglected does this simplify to \(di/dt=-V_F/L\).

    A simple parallel diode results in slower demagnetization compared to clamping schemes operating at higher voltages, thereby lengthening relay release time. In practice, contact release time is governed not only by coil current decay, but also by magnetic properties and mechanical dynamics including return spring forces. When faster release is required, Zener diode or TVS clamps are evaluated, provided that the switch breakdown voltage and clamp energy ratings are properly verified. Specific component selection is examined in detail in Flyback Diode Selection and Relay Release Time.

    This DC parallel diode configuration must never be applied directly to AC coils, because the diode would conduct heavily during one half-cycle. For AC loads, appropriate suppression methods such as RC snubbers, MOVs, or bidirectional TVS diodes must be evaluated according to ratings and operating conditions.

    4. How Does an Inductor Operate in a Buck Converter?

    A buck converter is a switching power supply that generates a DC output voltage lower than its input. Here, we assume ideal steady-state continuous conduction mode (CCM), neglecting losses, with an output voltage that remains virtually constant across the switching cycle and an inductor current that stays strictly positive. Inductor current reference is defined from switching node SW to the output, and inductor voltage is defined as the voltage at SW minus the output voltage.
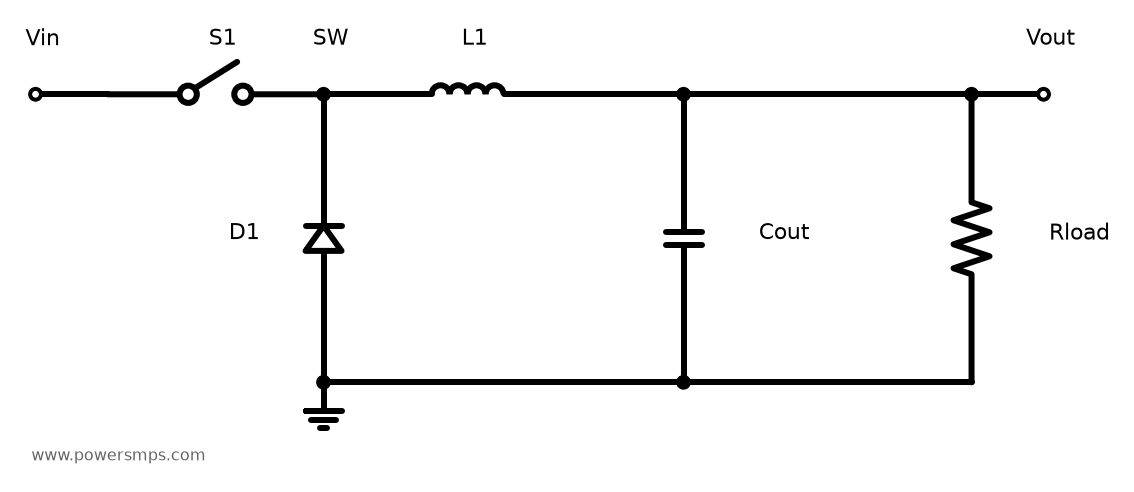
    Schematic of an asynchronous buck converter power stage. When high-side switch S1 is ON, current is supplied from the input; when OFF, current is supplied to the output via the GND→D1→L1 freewheeling path. Control circuitry and input bypass capacitors are omitted.
    Schematic of an asynchronous buck converter power stage. When high-side switch S1 is ON, current is supplied from the input; when OFF, current is supplied to the output via the GND→D1→L1 freewheeling path. Control circuitry and input bypass capacitors are omitted.
    Interval Current Path Inductor Voltage Current Trend
    High-Side Switch ON Input → High-Side Switch → Inductor → Output → GND \(V_{in}-V_{out}\) Increase
    High-Side Switch OFF GND → Freewheeling Diode or Conducting Low-Side MOSFET → Inductor → Output → GND \(-V_{out}\) Decrease

    During the ON interval, the input delivers energy to the load while stored energy in the inductor increases. During the OFF interval, the inductor’s stored energy decreases as it continues supplying current to the output. In a synchronous buck converter, the controller drives the low-side MOSFET to form this freewheeling conduction path.

    Using switching period \(T_s\) and duty cycle \(D\), the steady-state inductor voltage satisfies the volt-second balance principle:

    \[(V_{in}-V_{out})DT_s-V_{out}(1-D)T_s=0\]

    Consequently, under ideal CCM conditions, the following relationship holds:

    \[D=\frac{V_{out}}{V_{in}}\]

    Calculating Ripple Current and Peak Current

    The inductor current alternates between rising and falling around its average value. The peak-to-peak ripple current is given by:

    \[\Delta I_{pp}=\frac{(V_{in}-V_{out})D}{Lf_s}=\frac{V_{out}(1-D)}{Lf_s}\]

    where \(f_s=1/T_s\). In steady state, the average inductor current equals the output load current, while the output capacitor absorbs most of the ripple component to minimize output voltage variations.

    \[I_{pk}=I_{out}+\frac{\Delta I_{pp}}{2},\qquad I_{min}=I_{out}-\frac{\Delta I_{pp}}{2}\]

    For an educational calculation example, assume an input of 12V, output of 5V, switching frequency of 100kHz, inductance of 100µH, and output current of 1A.

    Calculation Parameter Result
    Duty cycle \(D=5/12\) Approx. 0.417, or 41.7%
    Period \(T_s=1/f_s\) 10µs
    Ripple current \(\Delta I_{pp}\) Approx. 0.292App
    Peak current \(I_{pk}\) Approx. 1.146A
    Valley current \(I_{min}\) Approx. 0.854A

    Since the valley current is greater than 0, this calculation is consistent with the CCM assumption. The waveforms below illustrate these identical conditions computed from the mathematical model.
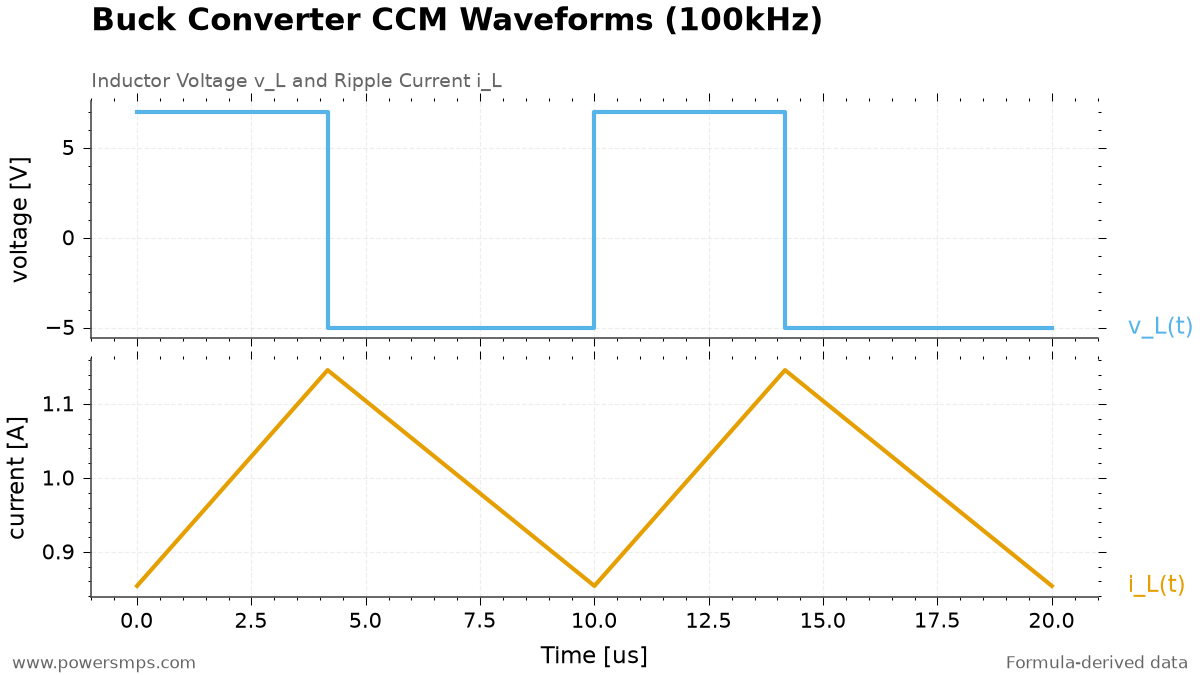
    Ideal CCM voltage and current waveforms assuming 12V→5V, 100kHz, 100µH, and output 1A. Formula-based calculation, not measured waveforms.
    Ideal CCM voltage and current waveforms assuming 12V→5V, 100kHz, 100µH, and output 1A. Formula-based calculation, not measured waveforms.

    When the load decreases such that the inductor current drops to 0 and reverse current is blocked, the converter can enter discontinuous conduction mode (DCM) where an interval with 0 current occurs. Under DCM, the simple conversion ratio above is no longer directly applicable. Conversely, a forced-CCM synchronous buck converter can allow negative inductor current at light loads, so light-load operation does not necessarily imply DCM.

    5. Beyond Inductance (L): Key Ratings for Real Inductors

    Parameter Significance Value to Compare in Circuit
    Inductance \(L\) and Tolerance Affects rate of current change and ripple In-circuit L accounting for DC bias, temperature, and tolerance
    Saturation Current \(I_{sat}\) Current at which L drops by a manufacturer-specified percentage from its zero-bias value Worst-case peak current
    Temperature Rise Current Rating \(I_{rms}\) Current producing a specified temperature rise under manufacturer test conditions RMS current of the actual waveform and operating environment
    DCR DC resistance of the winding Voltage drop and \(I_{rms}^2\mathrm{DCR}\) loss
    Core and AC Winding Losses Losses caused by switching flux swing and AC current Manufacturer loss data under frequency, ripple, and temperature conditions

    The saturation current rating is not a threshold where current cuts off or the device instantly fails; rather, it is the benchmark at which inductance drops by a specified percentage. Designers must check the manufacturer’s defined inductance rolloff criteria and verify how much L is maintained under operating temperature and peak current conditions. If L decreases, the current changes more rapidly under the same voltage, which can increase ripple and peak currents.

    The temperature rise rating is likewise determined under standardized laboratory test conditions and does not directly guarantee component temperature in an actual operating environment. Ambient temperature, PCB thermal dissipation, and AC losses must be evaluated collectively. When selecting components, carefully verify and compare the specific test conditions and inductance drop percentages specified for \(I_{sat}\) and \(I_{rms}\) in the datasheet.

    The RMS value of the triangular current waveform in the CCM model above can be calculated as follows:

    \[I_{L,rms}=\sqrt{I_{out}^2+\frac{\Delta I_{pp}^2}{12}}\]

    Component selection must account not only for nominal load, but also for input voltage range, startup and load transients, IC current limits, and inductance tolerances. Because DC losses from DCR alone cannot account for core losses and AC winding losses, consult manufacturer loss modeling tools and verify actual operating temperatures.

    6. Connecting the Three Applications

    When turning off a relay, one must provide a freewheeling path for coil current and safely handle the stored energy. In a buck converter, the same property of current continuity is leveraged to sustain continuous output current between switching states. In both cases, the foundational starting point is the linear inductor relationship: voltage governs the rate of current change, and stored energy is proportional to the square of current.

    When reviewing circuit designs, it is advisable to verify the following checklist:

    • Are the relay coil OFF current path and diode polarity correctly oriented?
    • Does the protection scheme satisfy both clamp voltage limits and relay release time requirements?
    • Do the circuit conditions match the buck converter design assumptions (CCM, steady state, lossless)?
    • Have in-circuit inductance (L), peak current, RMS current, operating temperature, and total losses all been verified?

    For detailed selection of relay driver switches, refer to 3.3V MCU Relay Driver MOSFET Selection; for passive component fundamentals, see Capacitor Basics and Resistor Basics.

    References

  • LinkSwitch-TN2 LNK3294 and LNK3296 Design Guide: Standby Power Reduction and FB Pin ON/OFF Control

    LinkSwitch-TN2 LNK3294 and LNK3296 Design Guide: Standby Power Reduction and FB Pin ON/OFF Control

    Non-isolated offline buck converters are widely used as auxiliary power supplies for smart meters, appliance control units, industrial sensors, and IoT devices. Power Integrations’ LinkSwitch-TN2 900V series (LNK3294, LNK3296) integrates a 900V-rated power MOSFET, oscillator, ON/OFF control logic, and a high-voltage bias current source onto a single IC, minimizing external component count while delivering high reliability in harsh power grid environments.

    To reduce standby power below 30mW, an external bias design based on the EcoSmart architecture is essential. In addition, precisely calculating the FEEDBACK (FB) pin ON/OFF control resistor for the newer 2.0V reference voltage and securing 900V high-voltage safety clearances are required to ensure stable operation of the LNK3294 and LNK3296.


    1. Overview, LNK3294 vs. LNK3296 Specification Comparison, and Device Selection Criteria

    The LinkSwitch-TN2 900V family supports non-isolated buck, buck-boost, and isolated/non-isolated flyback topologies, and features an integrated 900V \(BV_{\text{DSS}}\) rated MOSFET. For industrial inputs exceeding the 85~265 VAC universal input range, suitability should not be evaluated solely by the 900V rating; steady-state DRAIN voltage, surge, clamp, and thermal conditions of the operating circuit must also be verified. Although the LNK3294 and LNK3296 share identical control architectures and pinouts, clear differences in class exist in internal MOSFET die size, on-resistance (\(R_{\text{DS(on)}}\)), peak current limit (\(I_{\text{LIMIT}}\)), and maximum output current capability.

    Parameter LNK3294 LNK3296 Design Notes
    MOSFET Breakdown Voltage (\(BV_{\text{DSS}}\)) 900 V 900 V Identical voltage rating platform
    Internal MOSFET \(R_{\text{DS(on)}}\) (100°C) Approx. 31.0 Ω Approx. 9.70 Ω Conduction loss reduced by larger die size
    Peak Current Limit (\(I_{\text{LIMIT(typ)}}\)) 257 mA (Min. 240 mA / Max. 275 mA) 482 mA (Min. 450 mA / Max. 515 mA) LNK3296 delivers approx. 1.9x higher peak current
    Maximum Output Current (Buck, MDCM) Up to 120 mA Up to 225 mA Mostly discontinuous conduction mode
    Maximum Output Current (Buck, CCM) Up to 170 mA Up to 360 mA Continuous conduction mode
    Available Package Options PDIP-8C (P), SMD-8C (G) PDIP-8C (P), SMD-8C (G) Per official datasheet
    Recommended Target Load Range MCU boards, sensor nodes (~1~2W class) Relay driving, Wi-Fi communication modules (3~5W+ class)

    According to the manufacturer’s official datasheet 900V output current table and ordering information, the LNK3294 and LNK3296 are available in PDIP-8C (P) and SMD-8C (G). Because SO-8C (D) is exclusive to the 725V family, designs must not assume LNK3294D or LNK3296D. Regardless of package selection, sufficient copper area must be provided for the SOURCE pins, and junction temperatures must be verified under actual input, load, and ambient temperature conditions.


    2. EcoSmart Standby Power Reduction Mechanism: Self-Biasing vs. External Bias Design

    LinkSwitch-TN2 employs a simple ON/OFF control scheme that enables or disables switching cycles based on the load. The standby supply current specified by the manufacturer is less than 100 µA. However, the overall no-load standby power of the converter differs significantly depending on the bias supply architecture.

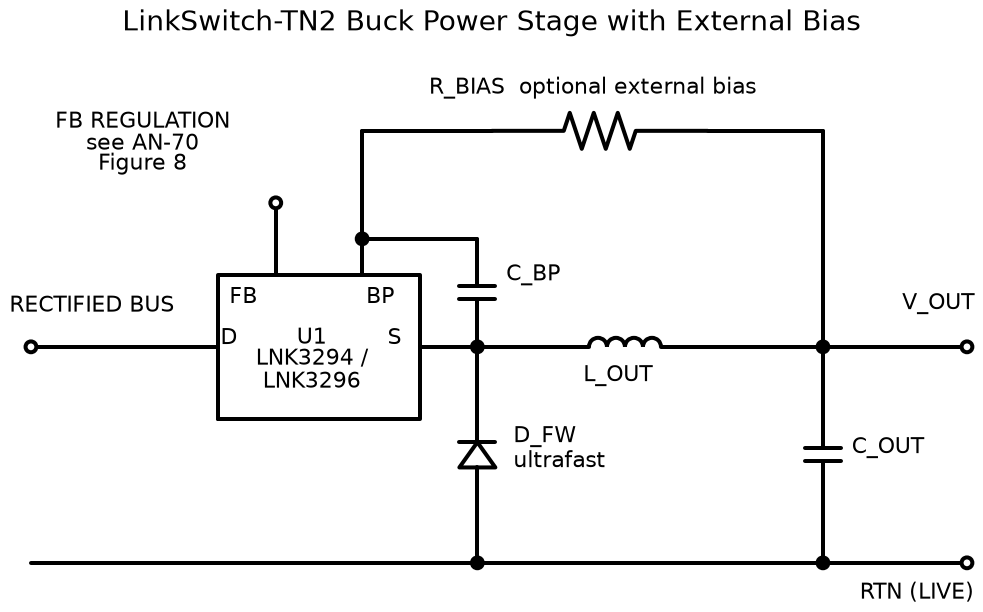
    LinkSwitch-TN2 non-isolated buck converter external bias schematic
    LinkSwitch-TN2 non-isolated buck power stage and external bias schematic

    2.1 Self-Biasing Operation and Loss Factors

    In self-biasing mode, without external bias components (\(D_{\text{BIAS}}\), \(R_{\text{BIAS}}\)), the internal high-voltage current source connected to the DRAIN pin continuously charges the BYPASS (BP) pin capacitor (\(C_{\text{BP}}\)). Because the high-voltage rectified bus voltage (\(V_{\text{IN(DC)}}\)) is applied directly across the internal current source, continuous current draw across a several-hundred-volt drop results in standby losses on the order of 50 ~ 100 mW.

    2.2 Achieving Sub-30mW Standby Power via External Bias Configuration

    To minimize no-load standby power, from the output (\(V_{\text{OUT}}\)) or an auxiliary winding, a fast diode (\(D_{\text{BIAS}}\)) and a current-limiting resistor (\(R_{\text{BIAS}}\)) must be connected to inject bias current into the BP pin. When external current flows into the BP pin and maintains the operating voltage of the internal bias regulator, the internal high-voltage current source automatically shuts off. Consequently, direct leakage and drop losses from the high-voltage line are eliminated, significantly reducing no-load standby power to below 30 mW.

    The key to reducing standby power is disabling the internal high-voltage charging path using an external bias. Because actual no-load power consumption varies depending on input voltage and external component leakage currents, it must be verified on the finished product.


    3. FEEDBACK (FB) Pin ON/OFF Control Mechanism and Precision Resistor Design

    The FEEDBACK (FB) pin of the LinkSwitch-TN2 is not a conventional PWM voltage feedback node, but rather a current-sensing input that determines cycle-by-cycle switching decisions.

    3.1 FB Pin Control Thresholds and Operating Mechanism

    The current flowing into the FB pin (\(I_{\text{FB}}\)) is sampled at the beginning of each internal oscillator cycle.

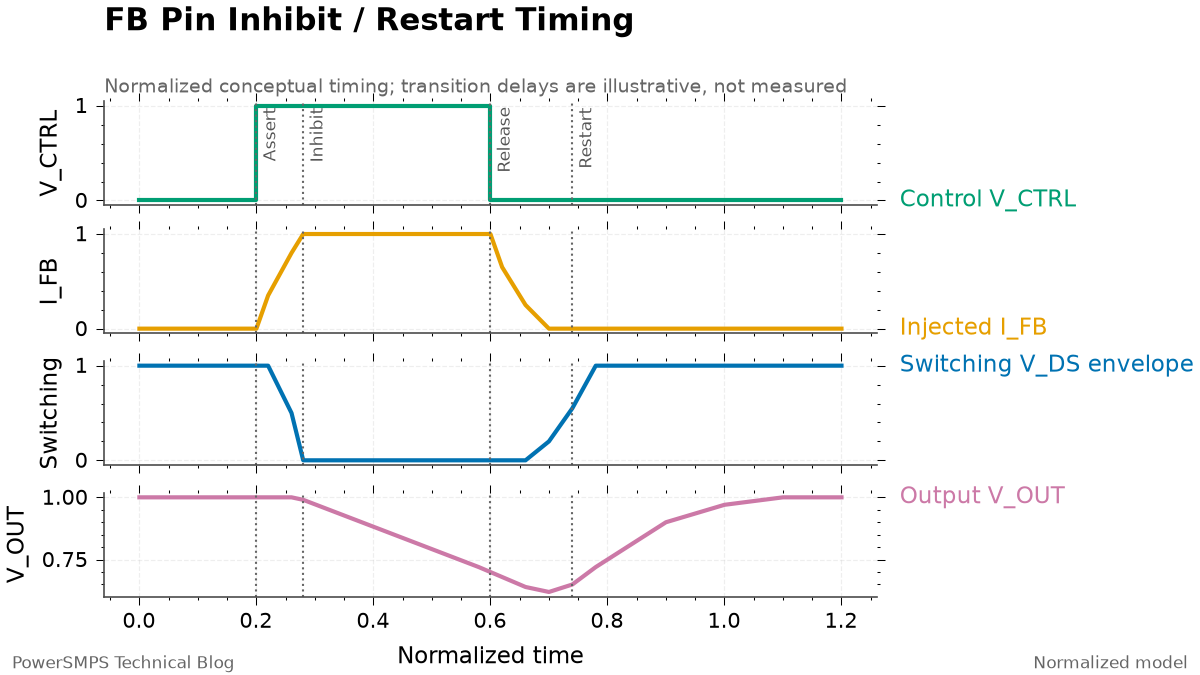
    1. Switching Inhibit Threshold (\(I_{\text{FB}}\)): When the current flowing into the FB pin exceeds a typical value of 49 µA, the internal comparator triggers to inhibit the MOSFET turn-on for that switching cycle.
    2. Line Overvoltage Shutdown Threshold (\(I_{\text{FBSD}}\)): If the FB pin input current exceeds \(I_{\text{FBSD}}\) (typical value of 670 µA) for 2 consecutive cycles, Line Overvoltage Protection (Line OVP) activates, completely halting switching and entering Auto-Restart mode.

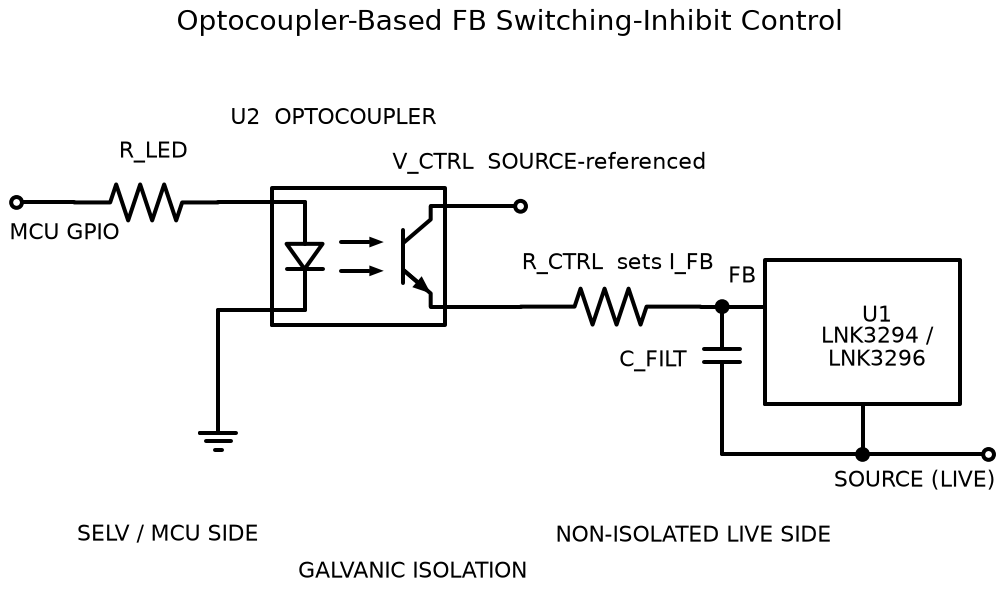
    Therefore, when injecting current into the FB pin via an external signal to forcefully disable switching, an adequate margin must be maintained so that the current is sufficiently above the switching inhibit threshold (49 µA) yet does not reach the overvoltage shutdown threshold (670 µA). The recommended control current range is 150 µA to 300 µA, with a design nominal value of approximately 200 µA.

    3.2 Newer 2.0V Reference Voltage: Control Resistor (\(R_{\text{ctrl}}\)) Calculation

    Care must be taken when dimensioning the control resistor not to adopt legacy LinkSwitch-TN parameters. The nominal FEEDBACK (FB) pin voltage (\(V_{\text{FB}}\)) of the newer LinkSwitch-TN2 is 2.0V (±1.25%). Applying the legacy LinkSwitch-TN value of 1.65V introduces calculation errors that risk deviating from the target injection current (200 µA).

    When the external control supply voltage is \(V_{\text{ctrl}}\), the correct calculation formula for control resistor \(R_{\text{ctrl}}\) is as follows:

    \[R_{\text{ctrl}} \approx \frac{V_{\text{ctrl}} – 2.0\,\text{V}}{200\,\mu\text{A}}\]

    For example, when \(V_{\text{ctrl}} = 5.0\,\text{V}\), \(R_{\text{ctrl}} \approx (5.0 – 2.0) / 200 \times 10^{-6} = 15\,\text{k}\Omega\) is obtained. If a 3.3V control supply is used, \(R_{\text{ctrl}} \approx (3.3 – 2.0) / 200 \times 10^{-6} = 6.5\,\text{k}\Omega\) (standard value of 6.2 kΩ or 6.8 kΩ) is applied.

    Optocoupler-based LinkSwitch-TN2 FB pin ON/OFF control schematic
    Optocoupler-based LinkSwitch-TN2 FB pin switching inhibit schematic
    Transient response timing waveforms for each signal during FB pin control signal assertion and release
    Transient response timing waveforms for each signal during FB pin control signal assertion and release

    Because the FB pin is a high-impedance node, it must be physically separated from switching nodes (DRAIN, inductor, freewheeling diode), and if necessary, a ceramic capacitor (\(C_{\text{FILT}}\)) of several tens of picofarads should be placed in parallel between the FB and SOURCE pins to prevent high-frequency switching noise coupling.


    4. Standby Mode Implementation Comparison: FB Pin Control vs. Output Load Disconnection (Load Switch)

    Methods for reducing power consumption when a system enters standby mode are broadly divided into the FB pin forced pull-up method and the output load switch (P-MOSFET) disconnection method.

    Comparison Item 1. Forced FB Pin Pull-Up Control (Switching Inhibit) 2. Output Load Disconnection (P-MOSFET / Load Switch) Design Considerations
    Controlled Target Inhibits IC internal MOSFET switching Physically disconnects the output power supply path
    No-Load Standby Power Excellent (sub-tens of mW) Relatively high (tens to hundreds of mW) FB control cuts off inductor/switching losses
    Switching EMI and Ripple Completely eliminated (switching stopped) Residual (converter continues pulse skipping) Advantageous during precision sensor measurement intervals
    Control Switch Component Rating Signal level (µA-class small TR or optocoupler) Power level (must handle rated load and inrush current) Reduces BOM cost and board area
    Conduction Loss (IR Drop) None Voltage drop occurs due to series \(R_{\text{DS(on)}}\) Affects efficiency at high load currents
    Recovery Speed (Turn-on) Requires restart and output capacitor charging time Relatively fast (if output is already charged) Consider system start-up time requirements

    In single-load systems where minimizing standby mode losses is paramount, the FB pin control approach—achievable with compact signal-level components—offers distinct advantages in BOM cost, mounting area, and thermal dissipation. Conversely, in environments such as communication modules where fast power recovery is required and output voltage must be maintained, adopting the output load switch method is more suitable.


    5. Non-Isolated Buck Key Power Component Selection Guide: Diode, Inductor, and Bypass Capacitor

    Because the high-voltage AC input connects directly to the inductor and switching device in a non-isolated buck converter, electrical ratings and limits of key power components must be strictly observed.

    5.1 Freewheeling Diode (\(D_{\text{FW}}\)): Mandatory Ultrafast Diode Application

    The freewheeling diode (\(D_{\text{FW}}\)), which sustains inductor current when the switching element turns off, must be an ultrafast recovery diode with a reverse recovery time (\(t_{\text{rr}}\)) of 75 ns or less, with a recommended specification of \(t_{\text{rr}} \le 35\,\text{ns}\). Because general-purpose standard rectifier diodes (such as 1N4007) exhibit reverse recovery times in the range of several microseconds, severe shoot-through current (reverse recovery current surge) flows from the high-voltage DC rail into the internal switch the instant the MOSFET turns on, causing immediate IC failure. Consequently, the use of general-purpose rectifier diodes such as 1N4007 is strictly prohibited.

    5.2 Output Inductor (\(L_{\text{OUT}}\)): Securing Core Saturation Current (\(I_{\text{sat}}\)) Margin

    If the inductor core saturates, inductance drops sharply, potentially causing excessive current to flow into the MOSFET. Therefore, the saturation current (\(I_{\text{sat}}\)) rating of the inductor must be equal to or greater than the maximum peak current limit (\(I_{\text{LIMIT(MAX)}}\)) of the LinkSwitch-TN2.

    • LNK3294: Since \(I_{\text{LIMIT(MAX)}} = 275\,\text{mA}\), ensure a margin of at least \(I_{\text{sat}} \ge 300\,\text{mA}\).
    • LNK3296: Since \(I_{\text{LIMIT(MAX)}} = 515\,\text{mA}\), ensure a margin of at least \(I_{\text{sat}} \ge 600\,\text{mA}\).

    5.3 BYPASS Capacitor (\(C_{\text{BP}}\)) Mounting Requirements

    A low-ESR ceramic capacitor (X7R or X5R dielectric) with a capacitance of 0.1 µF or 1.0 µF should be mounted at the BYPASS (BP) pin. Because this capacitor determines the bias supply stability of the internal control circuitry, it must be mounted immediately adjacent to the BP and SOURCE pins with minimal trace length to minimize parasitic inductance.


    6. High-Voltage Safety Standards and PCB Layout: 900V Clearance Distances and Galvanic Isolation Interfaces

    6.1 Output GND Potential and Galvanic Isolation in Non-Isolated Bucks

    In a non-isolated buck topology, the output GND is directly connected to the negative (-) terminal of the rectified AC input bus. Because the output terminals are not referenced to protective earth (PE) and float at high-voltage AC line potentials, galvanic isolation devices such as optocouplers must be implemented when interfacing control signals with external system interfaces or host microcontrollers (MCUs) to prevent electrical shock hazards and controller damage.

    6.2 900V High-Voltage Clearance Distances and PCB Layout Rules

    To comply with safety standards and ensure reliable operation, apply the following layout guidelines.

    1. DRAIN Pin Isolation Distance: Apply a clearance of at least 2 mm around the DRAIN pin as an initial layout baseline. However, final creepage and clearance distances must be recalculated based on applicable safety standards, operating voltages, material groups, pollution degrees, overvoltage categories, and altitude conditions. If necessary, consider milling air slots between adjacent conductors.
    2. Primary Thermal Path: Allocate a large copper pour to traces connected to the SOURCE pins to lower thermal resistance.
    3. High-Frequency Current Loop Minimization: Minimize the loop area of the high-frequency switching loop (\(\text{high-d}i/\text{d}t\) loop)—formed by the input capacitor, MOSFET DRAIN-SOURCE, and freewheeling diode—to suppress radiated EMI.

    Official Reference Documentation: Power Integrations LinkSwitch-TN2 Family Data Sheet, Rev. Q (June 2023). Orderable component packages, current limits, output currents, and FB pin thresholds should be cross-checked against the latest revision during actual design.

  • Solving Light-Load Ripple Without an LDO: TPS54202 Eco-Mode vs TPS54308 FCCM — A Hands-On Comparison

    Solving Light-Load Ripple Without an LDO: TPS54202 Eco-Mode vs TPS54308 FCCM — A Hands-On Comparison

    When selecting a step-down converter for ripple-sensitive circuits, picking solely by rated current and efficiency is a recipe for trouble. Converters that engage Eco-mode or pulse skipping at light loads can see output ripple soar to tens of mV, severely degrading the performance of analog sensors, RF front-ends, and PLL/VCO supply rails. Texas Instruments’ TPS54202 and TPS54308 share the same 6-pin SOT-23 package and identical pinout, yet they differ decisively in light-load operating mode — a difference that completely changes the choice for ripple-sensitive designs.


    The Ripple Problem in Sensitive Circuits

    When generating a 5V or 3.3V local rail from a 24V industrial bus, the most common choice is a synchronous step-down converter. But in systems where the load is not constant — think IoT gateways where current consumption swings from a few mA during sensor polling idle periods to hundreds of mA during active cycles, or wireless modules that draw single-digit mA in standby but surge past 1A during transmission — the output ripple during light-load intervals becomes a real problem. As the load lightens, the converter enters pulse-skipping mode, the switching frequency becomes irregular, and the output capacitor repeatedly charges and discharges, dramatically increasing ripple amplitude.

    The trouble with this ripple goes beyond mere voltage variation. When the ripple frequency components overlap with an ADC’s sampling bandwidth, effective resolution (ENOB) takes a hit. It couples directly into PLL phase noise, and survives as system noise that even the CMRR of an analog signal chain cannot reject. Switching to an LDO eliminates the ripple, but in a 24V-to-5V step-down, an LDO manages only about 21% efficiency — at 1A load, that means 19W of heat. You’re trading ripple for a heatsink and extra board area.

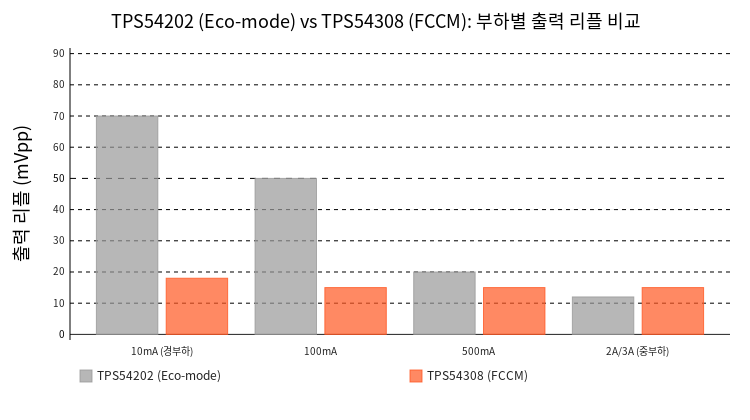
    TPS54202 vs TPS54308 output ripple comparison by load current
    Figure 1: Output ripple (mVpp) comparison between TPS54202 (Eco-mode) and TPS54308 (FCCM) across load currents — the ripple difference becomes dramatic at light loads.

    Why Eco-Mode Ripple Grows at Light Load

    The TPS54202 is a 2A converter employing fixed 500kHz peak current-mode control with Advanced Eco-mode™. Eco-mode works by skipping switching cycles when the load drops below the level that the high-side FET’s minimum on-time can sustain — the converter only turns on the FET when the output voltage falls below the setpoint, then returns to idle once the target is reached. The impressively low 45μA no-load quiescent current (Iq) is a direct consequence of this Eco-mode operation.

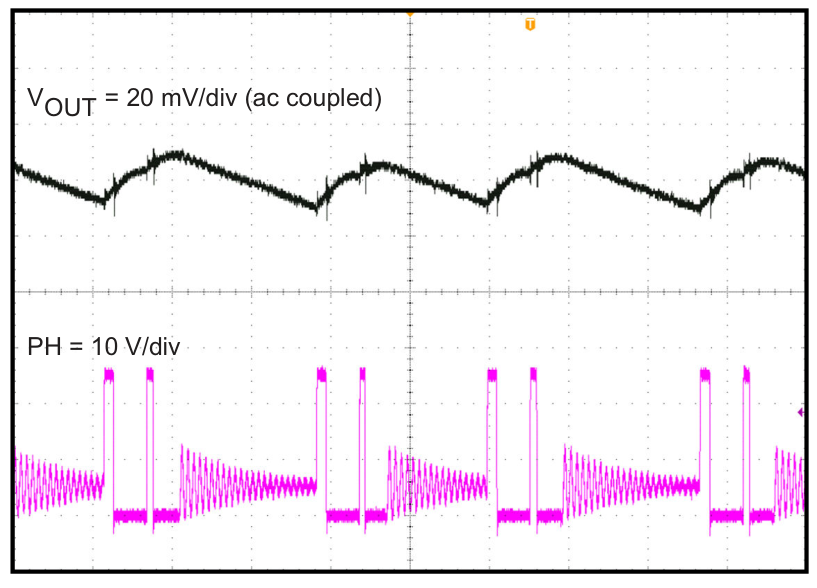
    This efficiency optimization comes at a cost, however. During pulse-skipping intervals, the effective switching frequency can drop to just a few hundred Hz. A single burst of energy overcharges the output capacitor, and the load slowly bleeds it off — a pattern that repeats. As a result, output ripple amplitude climbs from 10–15mV at heavy load to 40–80mV at light load, and can exceed 100mV under certain conditions. The ripple frequency also becomes irregular, making it difficult to filter out any specific band with a notch filter.

    TPS54202 Eco-mode light-load 100mA output ripple oscilloscope waveform
    Figure 2: TPS54202 oscilloscope capture — at IOUT=100mA light load, VOUT ripple appears large on a 20mV/div scale, and the switching node (PH) waveform becomes irregular due to pulse skipping. (Source: TI TPS54202 datasheet Figure 7-8)

    How FCCM Solves the Ripple Problem

    The TPS54308 comes in the same 6-pin SOT-23 package with an identical pinout to the TPS54202, but there is one decisive difference: it operates in FCCM (Forced Continuous Conduction Mode), never stopping switching even at light load. No matter how low the load current drops, the 350kHz switching frequency remains constant, and the inductor current is allowed to flow in the negative direction to maintain continuous conduction. This design philosophy trades away some light-load efficiency (Iq = 300μA, versus 45μA for the TPS54202) in exchange for keeping output ripple predictably low across the entire load range.

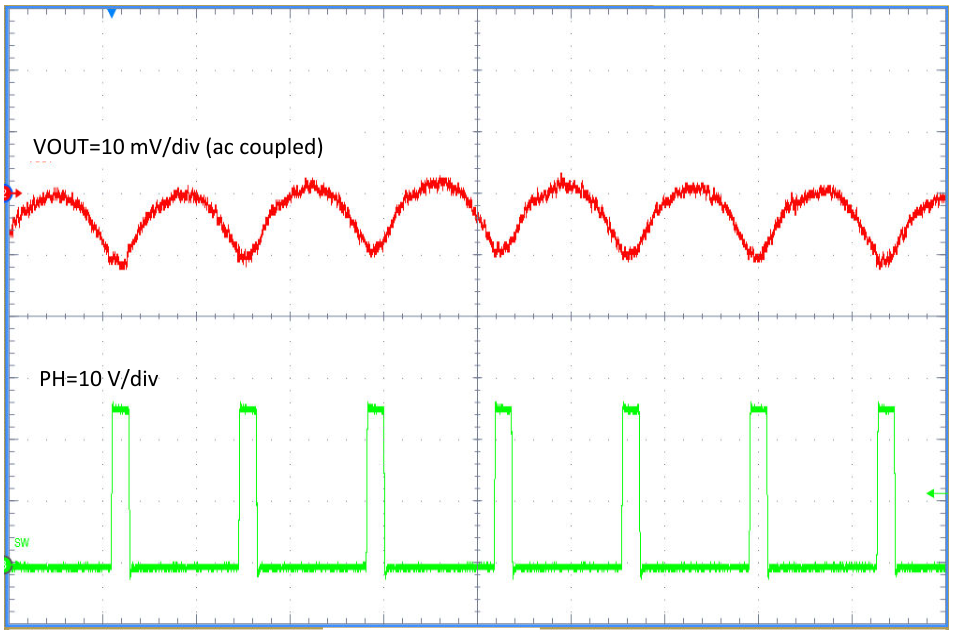
    In FCCM, output ripple is fundamentally determined by \( \Delta V_{OUT} \approx \Delta I_L \times ESR + \Delta I_L / (8 \times f_{SW} \times C_{OUT}) \), where \( \Delta I_L \) itself is fixed by the constant switching frequency and duty cycle. There is no structural reason for ripple to increase at light load. In practice, with a 12V-to-5V, \( L = 10\mu H \), \( C_{OUT} = 2 \times 22\mu F \) MLCC configuration, the TPS54202 exhibits over 60mVpp ripple at light load (10mA), while the same board fitted with a TPS54308 keeps ripple within 15–20mVpp. With ripple frequency locked at 350kHz, an additional notch filter targeting that single band can further suppress it.

    TPS54308 FCCM light-load 100mA output ripple oscilloscope waveform
    Figure 3: TPS54308 oscilloscope capture — under identical light-load conditions (IOUT=100mA), VOUT ripple is suppressed to a 10mV/div scale thanks to FCCM, and the PH waveform remains steady at a fixed 350kHz. (Source: TI TPS54308 datasheet Figure 8-8)

    Why Not Just Use an LDO?

    The first workaround an engineer facing a ripple problem reaches for is an LDO. Output ripple is virtually nonexistent at the μV level, and the external BOM is just two capacitors. But this choice inflicts a severe efficiency penalty, especially when the input-to-output voltage differential is large. For example, an LDO supplying 5V at 0.5A from a 24V input dissipates \( (24V – 5V) \times 0.5A = 9.5W \) — nearly four times the power delivered to the load (2.5W). A SOT-223 package cannot handle this thermally, and even a TO-220 with a heatsink will cook nearby components.

    The TPS54308 FCCM converter, under the same conditions (24V to 5V, 0.5A), delivers roughly 88–90% efficiency, meaning the converter itself dissipates only about 0.28W. That’s a 97% reduction in loss compared to the LDO — translating directly to no heatsink required, a tiny SOT-23 6-pin package, and layout freedom on tight boards. Moreover, the FCCM keeps ripple at a sufficiently low 15–20mVpp — not quite LDO levels, but adding a single LC filter stage after the converter can bring it below 5mVpp for ultra-low-noise rails.

    ApproachOutput RippleEfficiency (24V→5V, 0.5A)Power LossHeatsink
    LDO (e.g., LM7805)~μVpp21%9.5WRequired (TO-220 + heatsink)
    TPS54202 (Eco-mode)60–80mVpp (light load)~90%0.28WNot required
    TPS54308 (FCCM)15–20mVpp~89%0.31WNot required
    Table 1: Ripple-efficiency trade-off among LDO, Eco-mode converter, and FCCM converter

    Real-World Swap: TPS54202 to TPS54308

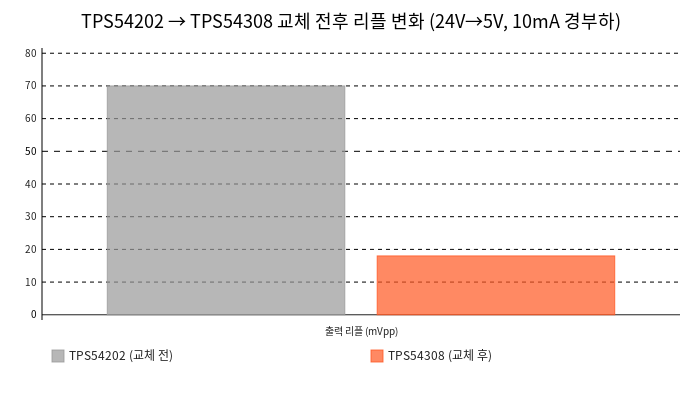
    On a sensor interface board operating from 24V, producing 5V for a variable 10mA–500mA load, the initial design using the TPS54202 performed well at medium-to-heavy loads (200mA and above). But during the idle periods between sensor polling cycles (approximately 10–15mA), output ripple shot up to 70mVpp. This ripple jittered the LSB of a 16-bit ADC by 4–5 bits, dragging effective resolution down to roughly 11 bits — and software averaging could not fully eliminate it.

    After swapping to the TPS54308 on the same board, with the same \( L = 10\mu H \) and \( C_{OUT} = 2 \times 22\mu F \) components, light-load ripple dropped to 18mVpp — a 74% reduction. Thanks to the fixed 350kHz switching frequency, the ripple FFT spectrum also concentrated into a single peak. ADC effective resolution recovered to 14.2 bits, and with software oversampling, better than 15 bits was achievable. Power dissipation increased by roughly 30mW (from the Iq difference of 45μA to 300μA), but overall efficiency remained at 89% with no thermal issues whatsoever.

    Notably, the TPS54202 and TPS54308 share the exact same pinout (1: GND, 2: SW, 3: VIN, 4: FB, 5: EN, 6: BOOT). All these improvements were obtained by simply desoldering the TPS54202 and soldering in a TPS54308 — zero PCB changes required. One minor consideration: the TPS54308 switches at 350kHz versus the TPS54202’s 500kHz, so adjusting the inductor value can further optimize for the same ripple target if desired.

    Before and after replacing TPS54202 with TPS54308 — ripple reduction
    Figure 4: Ripple comparison before and after replacing TPS54202 with TPS54308 on the same PCB — a 74% reduction from 70mVpp to 18mVpp, restoring ADC effective resolution from 11 bits to 14.2 bits.

    Spec Comparison and Selection Criteria

    ParameterTPS54202TPS54308
    Input Voltage4.5–28V4.5–28V
    Output Current2A3A
    Integrated FETs (HS+LS)148 + 78mΩ85 + 40mΩ
    Switching Frequency500kHz (spread spectrum)350kHz (fixed)
    Light-Load ModeAdvanced Eco-mode™ (pulse skip)FCCM (forced continuous conduction)
    Quiescent Current (Iq)45μA300μA
    Soft Start5ms (internal)5ms (internal)
    ProtectionOCP, OVP, TSDOCP, OVP, TSD
    PackageSOT-23 (6)SOT-23 (6)
    PinoutGND-SW-VIN-FB-EN-BOOTGND-SW-VIN-FB-EN-BOOT (identical!)
    Table 2: TPS54202 vs TPS54308 specification comparison

    For ripple-sensitive analog circuits, precision sensor supplies, or local rails in RF blocks, the predictable low ripple that the TPS54308’s FCCM delivers is far more valuable than the TPS54202’s light-load efficiency advantage. Conversely, in battery-powered devices where light-load efficiency directly governs runtime and the load consists of ripple-tolerant digital circuits, the TPS54202’s 45μA Iq and Eco-mode make it the better choice. Since both parts share an identical pinout, the most practical approach during prototyping is to test both, measure ripple and efficiency, and make the final decision based on real data.