Table of Contents
- Why I Am Preparing for the RK3688 Comparison
- When Will RK3688 Be Available?
- RK3588 vs. RK3688: How Much Faster Will It Be?
- Temperatures and NPU Clocks Across 7002 Sensor Readings
- Differences Between Single MatMul and Full Inference Performance
- Five Tests to Repeat After Purchasing the RK3688
- What I Expect from the RK3688
Why I Am Preparing for the RK3688 Comparison
The reason for waiting for the RK3688 is simple. I want to see how much faster image generation—which took a long time on the ROCK 5C—will become on the new board. While looking into the chip news, I also revisited the empirical measurement records I had accumulated.
As of 2026-10-27, I am planning to purchase RK3688 hardware. Using the records from directly running the ROCK 5C as a starting point, I organized the items I want to compare once the new equipment arrives.
When Will RK3688 Be Available?
Following recent updates, what caught my attention was the product sequence. Looking at Rockchip’s disclosures alongside Radxa’s materials outlines which boards will arrive first and which will require waiting a bit longer.
In the Rockchip 2026 Q3 Quarterly Report, Rockchip explained that RK3668 will enter production soon, followed subsequently by RK3688. This indicates that RK3668 will appear on the market ahead of the RK3688 I am waiting for.
Also interesting from the Radxa official download server rock6/6b directory is the Rockchip RK3668 SoC Application REL02. In this 2026-10-09 page document, the RK3668 CPU is listed as consisting of 6 Cortex-A725 cores and 2 Cortex-A520 cores, with an NPU rated at 44 TOPS Sparse, and engineering samples slated for 2027 Q1.
In particular, it is noteworthy that the document is hosted in the rock6/6b directory. Personally, I look forward to seeing what chip and memory configurations will appear in the ROCK 6 series. It would be even more welcome if the options extend from SBCs to highly expandable boards.
Rockchip also introduced the RK3668 and RK3688 as its next high-performance platforms in the Rockchip official high-performance SoC roadmap announcement. I am keenly watching to see what kind of upgrade path these two chips will offer for those using the RK3588 series.
Looking at the schedule, the picture I anticipate is that boards based on the RK3668 will arrive first, followed by RK3688 boards. Personally, rather than chasing immediate sale dates, I place more weight on watching whether boards that can actually be purchased become available next year. Along with release news, I am also looking forward to the SDK and memory configurations.
RK3588 vs. RK3688: How Much Faster Will It Be?
Comparing RK3588 and RK3688 on Paper
First, I summarized the performance differences I am anticipating. The RK3688 specifications are planned figures based on the specification slides revealed at the 2025 Rockchip Developer Conference. Placing them side by side with the RK3588S2 configuration of the ROCK 5C I currently use makes it clearer why I look forward to this upgrade.

| Item | Current RK3588 Series / ROCK 5C | RK3688 Published Plan | Anticipated Change |
|---|---|---|---|
| CPU Configuration | 4×Cortex-A76 + 4×Cortex-A55, 8 Cores | 8×Cortex-A730 + 4×Cortex-A530, 12 Cores | 1.5× total cores and 2× big cores for parallel workload headroom |
| CPU Integer Throughput | Reference value of 93K DMIPS from materials | 300K DMIPS or higher | Throughput roughly 3.2× relative to the reference value |
| NPU | 6 TOPS (INT8) | RKNN-P3, 32 TOPS or higher | Nominal peak compute roughly 5.3×, expecting real-world model acceleration |
| GPU | Mali-G610 MC4 | Mali-Magni, 2.0 TFLOPS or higher | Anticipated increase in graphics and GPU compute headroom |
| Memory | My board: 8GB LPDDR4x | LPDDR5/5x/6, planned up to 200GB/s | Anticipating relief for large model loading and data transfers |
The CPU undergoes major changes not only in core count but also across architecture generations. Comparing the reference 93K DMIPS of the RK3588 with the planned 300K DMIPS for the RK3688 yields roughly 3.2×. I expect this difference will be particularly welcome during CPU preprocessing, postprocessing, and concurrent multitasking. Whether single-thread speed or VAE time scales by the same multiple will need to be observed separately under real workloads.
The NPU increase from 6 to 32 TOPS is roughly 5.3×. Looking at the numbers alone, this is the most anticipated aspect, but the Anima pipeline I use mixes FP16 DiT execution with CPU processing. Therefore, in the time projections below, instead of directly applying the INT8 TOPS multiple, I separately assumed how much faster the entire denoising stage—including data movement and CPU processing—would become. For the GPU, I am looking forward to the architectural generation shift and the target of over 2.0 TFLOPS.
Memory is another key motivation for upgrading. Moving from the current 8GB LPDDR4x environment to a board with faster memory and ample capacity should make model loading and repeated runs noticeably smoother. Because the maximum of 200GB/s is a chip design target from reference materials, I also intend to examine the actual memory configuration of the board I purchase closely.
Empirical Usage Records Accumulated on the Current Board
The baseline for comparison is the ROCK 5C 8GB that I operated. While waiting for the new board, I first reexamined where the existing environment spent its time and how warm it became.
The board I used is the RK3588S2 model, the standard edition in the Radxa official ROCK 5C documentation, equipped with 8GB of memory. In software, the runtime target is specified as rk3588. Because the Lite model uses the RK3582, I recorded both the board name and chip name.
The workload used for measurements is the 512×512 Anima image generation covered earlier in RKNN Conversion and Execution Results on ROCK 5C 8GB. The NPU and CPU divide the tasks as follows:
| Pipeline Stage | Processing Unit | Role |
|---|---|---|
| Text Encoding | CPU | Prompt context generation |
| DiT Attention / FFN | NPU | Execution of partitioned FP16 RKNN graphs |
| Normalization, Gating, and Residual Processing | CPU | Host operations and FP32 residual accumulation |
| VAE Decoding | CPU | Reconstruction of latent representations into final images |
A comprehensive recount of raw job logs collected from 2026-8-13 to 8-25 shows that out of 649 total generation attempts, 404 completed successfully and 245 failed. The detailed duration distribution for the 404 successfully completed jobs is as follows:
- Mean elapsed time: 1658.52 s (approx. 27.64 min)
- Median: 1627.29 s (approx. 27.12 min)
- Minimum elapsed time: 1513.56 s (approx. 25.23 min)
- Maximum elapsed time: 1911.67 s (approx. 31.86 min)
- 95th percentile (p95): 1799.59 s (approx. 29.99 min)
Among the 404 completed runs, 20 tasks (approximately 4.95%) exceeded 30 minutes. Because these records date from a period of switching between various step configurations, an average of 27.64 minutes per image reflects my typical operating speed at the time. On the RK3688, I want to see how much the waiting time decreases when matching the same step count. With logs of the 245 failed attempts also preserved, I plan to examine both completion times and failure modes together on the new hardware.
Temperatures and NPU Clocks Across 7002 Sensor Readings
Along with speed, the other metric I revisited was temperature. Aggregating 7002 sensor samples collected at approximately 1-minute intervals from 2026-8-20 to 8-25 revealed thermal shifts across each zone of the board quite distinctly.
Key statistics across thermal sensor zones observed across all 7002 sensor samples are as follows:
| Sensor Zone | Mean Temperature (°C) | Median (°C) | 95th Percentile (°C) | Max Observed Temperature (°C) |
|---|---|---|---|---|
bigcore0-thermal |
40.22 | 39.77 | 59.15 | 75.77 |
bigcore1-thermal |
40.37 | 39.77 | 59.15 | 75.77 |
littlecore-thermal |
39.72 | 38.85 | 56.38 | 70.23 |
soc-thermal |
39.19 | 38.85 | 54.54 | 69.31 |
npu-thermal |
38.21 | 37.92 | 51.77 | 64.69 |
center-thermal |
38.00 | 37.92 | 50.85 | 63.77 |
gpu-thermal |
37.35 | 37.00 | 49.00 | 61.00 |
Measurement environment: Onboard sensor readings from indoor operational logs. Ambient temperature and detailed heatsink/fan configurations at the time were unrecorded.
One aspect I viewed favorably was the NPU clock rate. Across the 7002 collected samples, the frequency under the rknpu_ondemand governor was maintained at 1,000,000,000 Hz, or 1.0 GHz. Peak temperatures for each sensor represent values recorded at their respective moments. On the new hardware, I want to combine these records with per-core load metrics to observe inference behavior in greater detail.
Thermal shifts are more intuitive when visualized on a graph. Below are 30 samples selected from a 15-minute window around the point when bigcore0 reached its peak of 75.769°C.
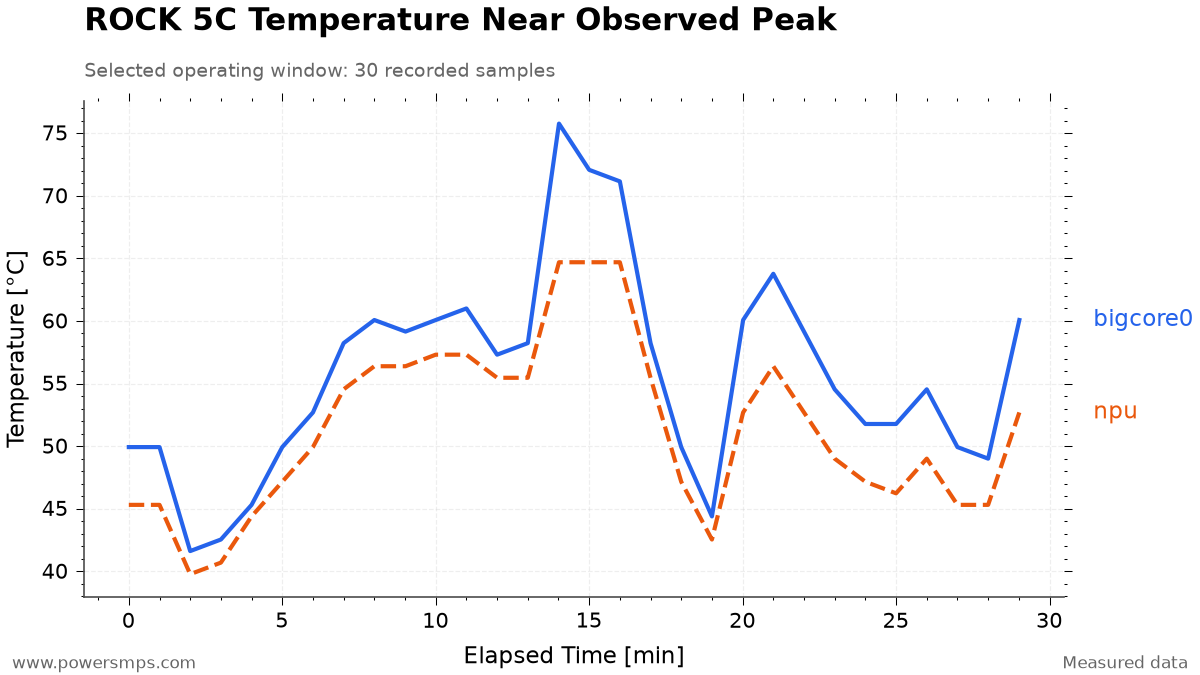
The bigcore0 temperature hovered around 50°C, surged to a peak of 75.769°C at minute 14, and exhibited dynamic characteristics by dropping to 49.923°C at minute 18. Over the same interval, the NPU temperature sustained a peak of 64.692°C between minutes 14 and 16 before cooling down gradually.
What stands out to me is how temperatures fluctuate dynamically with workload phases rather than staying at a static level. I am curious to see how this curve will differ on the RK3688. Alongside shorter waiting times, I also want to verify firsthand what degree of heatsink or fan cooling will be required for comfortable operation.
Differences Between Single MatMul and Full Inference Performance
On the Radxa ROCK 5C (RK3588 runtime target, RKNPU driver 0.9.8, RKNN Runtime 2.3.2), single-core benchmarks using the RKNN MatMul C API on primary shapes of the Anima DiT FFN block (Linear 1: M=1024, K=2048, N=8192 / Linear 2: M=1024, K=8192, N=2048, 34.36 GOP each) yielded the following results:
| Compute Path & Precision | Linear 1 Latency | Linear 2 Latency | Combined Sum | Speedup vs. FP16 |
|---|---|---|---|---|
| FP16 x FP16 -> FP16 | 51.89 ms | 460.61 ms | 512.50 ms | 1.00x |
| INT8 x INT8 -> INT8 | 19.13 ms | 115.67 ms | 134.80 ms | 3.80x |
| FP16 x FP16 -> FP32 | 57.93 ms | 463.10 ms | 521.03 ms | 1.00x |
| INT8 x INT8 -> INT32 | 100.80 ms | 118.32 ms | 219.12 ms | 2.38x |
What caught my eye in this table is the second Linear layer. Although both operations comprise 34.36 GOP each, executing the dimension-reducing Linear 2 in FP16 took 460.61 ms. The sum for the INT8 I/O path was roughly 3.80× faster than FP16, and roughly 2.38× faster in the INT32 output comparison. It was intriguing to see that perceived performance can vary substantially depending on operator shape and precision, even on the very same board.
In those tests, context creation was rejected for the W8A16 formats RKNN_FLOAT16_MM_INT8_TO_FLOAT32 and RKNN_FLOAT16_MM_INT8_TO_FLOAT16. When requesting core_mask=7 via the MatMul API, execution fell back automatically to a single core, and INT8 execution emitted a ‘failed to update out cvt offset!’ warning. Because of these experiences, I plan to verify supported precisions and actual core configurations first on the new board.
What concerned me even more than speed was output quality. In the W8A8 Quality Degradation and 8GB Resident Context Experiment, images generated using FFN Linear W8A8 were visually unsatisfactory, forcing a return to the FP16 configuration. I also experienced toolchain-dependent discrepancies in the Comparison Between RKNN Toolkit 2.3.2 and 2.3.0. Therefore, on the RK3688, what I am most eager to see is not just the raw TOPS figure, but how much speed can be gained while fully preserving the visual fidelity of the current model.
Five Tests to Repeat After Purchasing the RK3688
Once I purchase the equipment, I plan to run the following five tests sequentially across both boards. Evaluating them under identical conditions alongside board-specific optimizations should clarify which configuration provides the best practical usability.
The model, input prompt, precision, resolution, step count, and seed will be locked first. Documenting board revisions, memory specs, SDK versions, and cooling environments alongside them will make it straightforward to review the results later.
| Workload to Run | What I Want to Observe |
|---|---|
| Idle State | Temperatures and clocks under no load; standby power once metering equipment is prepared |
| All-Core CPU Load | Throughput comparisons across identical thread counts vs. all available cores on each board, logging sustained clock speeds and temperatures |
| Single NPU Operator | Execution latency and output numerical deviations across identical shapes and precisions; verifying actually accepted core configurations |
| Full Anima Inference | End-to-end latency including model loading, encoding, denoising, and VAE; comparing cold vs. warm runs |
| Long-Term Repeated Operation | Counts of completions vs. failures, p50 / p95 latencies, alongside memory, swap, temperature, and clock variations |
Once a power meter is ready, I also want to log power consumption over time during generation to calculate the energy consumed per image. Executable hashes will be recorded per board, and original models and inputs will be strictly matched for comparison.
Board-tailored optimizations, such as the Spectrum Optimization Technique, will be documented separately. This will allow assessing both baseline disparities and the most practical configurations for daily use.
What I Expect from the RK3688
How Many Minutes Will a 25.20-Minute Workload Take on the New Board?
Separate from the mixed-setting averages, I revisited a Spectrum 20-step run where stage-by-stage timings had been logged. Under conditions of 512×512 resolution, CFG 4.0, and seed 20260812, applying Spectrum to FP16 DiT followed by CPU VAE decoding took 1356.58 s for denoising and 155.46 s for VAE. The two stages combined totaled 1512.04 s, or approximately 25.20 minutes. The time ranges below cover these two stages, excluding prompt encoding and model loading.
I am hoping that this 25.20-minute baseline can be reduced to approximately 7~13 minutes on the RK3688. My primary projection centers around 9 minutes. Calculating with different acceleration assumptions for the denoising stage and CPU VAE yields the following:
| Scenario | Denoising Stage Assumption | CPU VAE Assumption | Combined Two-Stage Total |
|---|---|---|---|
| Current ROCK 5C Measurement | 1356.58 s | 155.46 s | 25.20 min |
| Conservative Expectation | 2× faster | 1.5× faster | 13.03 min projected |
| My Median Expectation | 3× faster | 2× faster | 8.83 min projected |
| Optimistic Case | 4× faster | 2.5× faster | 6.69 min projected |
The formula is 1356.58 s / denoising speedup multiple + 155.46 s / VAE speedup multiple. For instance, if overall denoising speeds up by 3× and CPU VAE speeds up by 2×, the total becomes roughly 8.83 minutes. These multiples represent scenarios I outlined based on the upgraded CPU, NPU, and memory specifications. In particular, proper support for FP16 operations and smooth integration with the RKNN toolchain will be necessary to approach the optimistic scenario.
After acquiring the board, I plan to remeasure denoising and VAE timings under the same 20-step configuration and place them alongside this projection table. Dropping to around 9 minutes per image would substantially transform the interactive flow of revising prompts and generating images. If thermal performance and fan noise improve as well, satisfaction with the upgrade will be even higher.
I look forward to seeing how significantly the RK3688 will alleviate long image generation latencies and memory pressure. If overall thermals, acoustics, and the ease of repeated execution improve alongside peak performance, the case for upgrading will become all the more compelling.
Once purchased, I plan to systematically update this article with processing times, image quality, memory usage, and thermal results. After verifying whether these expectations hold true in practice, detailed configurations and troubleshooting steps will be continued in follow-up posts.