For smoothing capacitors, after calculating capacitance from the allowable ripple, tolerance and minimum bus voltage must be verified. Taking a 60W SMPS with bridge-rectified 220Vac as an example, this article walks through the calculation and examines ripple and charging current using rectified waveforms.
The previous article ‘How to Select a Smoothing Capacitor’ covered voltage ratings and selection principles using Schade curves. Here, the initial capacitance is determined using the energy equation for a constant-power load. The numerical values are based on the conditions of the design example.
Table of Contents
- 1. Design Conditions: 220Vac, 60W, Ripple 40Vpp
- 2. Constant-Power Loads Are Calculated Using Energy Equations
- 3. Compare Candidate Capacitances Using Minimum Effective Values
- 4. How Much Do Circuit Waveforms Differ from Calculated Values?
- 5. Voltage Rating and Ripple Current Are Verified Separately
- 6. Selection Results for This Example
1. Design Conditions: 220Vac, 60W, Ripple 40Vpp
The target circuit consists of a single-phase bridge rectifier without PFC and an input bulk capacitor. The connection sequence is AC source → source resistance → bridge rectifier → bulk capacitor and DC/DC input load. The capacitor’s ESR is included in series, and the bus DC return is separated from protective earth. Because this calculation example deals with a high-voltage non-isolated section directly connected to utility power, it is structured as an example for circuit operation verification and numerical analysis.
| Parameter | Example Condition |
|---|---|
| Rated Input and Variation | 220Vac ±10%, i.e., 198~242Vac |
| Line Frequency | 50/60Hz, capacitance calculation based on 50Hz |
| DC/DC Output Power | 60W |
| DC/DC Stage Efficiency | Assumed to be 85% |
| Allowable Bus Ripple | 40Vpp |
| Capacitor Initial Capacitance Tolerance | −20% |
| Bridge Voltage Drop for Calculation | Sum of two conducting diodes 2V |
The 220Vac case serves as an appropriate baseline to explain the operation of line-operated SMPS. However, 85~264Vac universal input or PFC buses operate in different operating regimes and require separate calculations. The allowable ripple of 40Vpp is the target value for this design, and whether the downstream DC/DC can operate stably even at the ripple valley must be verified against the actual converter’s input range.
2. Constant-Power Loads Are Calculated Using Energy Equations
Assuming the DC/DC maintains output power, the average power drawn from the bus is as follows. Here, 85% is the efficiency assumed to evaluate the conversion power of the DC/DC stage, excluding losses in the bridge and input stage.
\[ P_{\mathrm{bus}}=\frac{P_{\mathrm{out}}}{\eta_{\mathrm{DC/DC}}} =\frac{60}{0.85}\approx70.59\,\mathrm{W} \]
Because the bus current is \(I=P_{\mathrm{bus}}/V_{\mathrm{bus}}\), it increases as the voltage drops during discharge. Therefore, rather than fixing a single current value in \(C=I\Delta t/\Delta V\) assuming a constant current, it is more appropriate to use the capacitor’s energy change.
\[ P_{\mathrm{bus}}\Delta t=\frac{1}{2}C_{\mathrm{eff}} \left(V_{\mathrm{hi}}^2-V_{\mathrm{lo}}^2\right),\qquad C_{\mathrm{eff}}=\frac{2P_{\mathrm{bus}}\Delta t}{V_{\mathrm{hi}}^2-V_{\mathrm{lo}}^2} \]
The ripple frequency of full-wave rectification is twice the line frequency. First, neglecting the charging time, the discharge time is taken as \(\Delta t\approx1/(2f_{\mathrm{line}})\), which is 10ms at 50Hz. This is a conservative 1st-order approximation with a longer discharge time to quickly estimate the initial capacitance. Appendix A of Power Integrations AN-92 also calculates the bulk capacitor from the energy balance of a constant-power load while the rectifier is blocked.
At the low line input of 198Vac, the calculated charging peak and target minimum voltage are as follows.
\[ V_{\mathrm{hi}}\approx198\sqrt{2}-2=278.01\,\mathrm{V},\qquad V_{\mathrm{lo}}=278.01-40=238.01\,\mathrm{V} \]
\[ C_{\mathrm{eff,min}}\approx \frac{2\times70.59\times0.010}{278.01^2-238.01^2} \approx68.4\,\mu\mathrm{F} \]
Applying an initial tolerance of −20%, a nominal capacitance of \(C_{\mathrm{nom}}\ge68.4/0.8\approx85.5\,\mu\mathrm{F}\) is required. Therefore, 100µF is selected as the initial candidate. Here, the initial tolerance is applied to establish a 1st candidate; in an actual design, the final margin is confirmed by also accounting for capacitance variation over temperature and operating lifetime.
3. Compare Candidate Capacitances Using Minimum Effective Values
Ripple can be recalculated and compared using the equation below. The effective capacitance in the comparison table is 80% of the nominal value, and the same low-line peak of 278.01V is used in the approximate calculation.
\[ V_{\mathrm{lo}}\approx\sqrt{V_{\mathrm{hi}}^2- \frac{2P_{\mathrm{bus}}}{2f_{\mathrm{line}}C_{\mathrm{eff}}}},\qquad \Delta V_{\mathrm{pp}}=V_{\mathrm{hi}}-V_{\mathrm{lo}} \]
| Nominal Capacitance | −20% Effective Capacitance | 50Hz Approximate Ripple | 60Hz Approximate Ripple | 50Hz Simulated Ripple |
|---|---|---|---|---|
| 68µF | 54.4µF | 51.4Vpp | 42.1Vpp | 40.4Vpp |
| 82µF | 65.6µF | 41.9Vpp | 34.4Vpp | 33.7Vpp |
| 100µF | 80µF | 33.8Vpp | 27.8Vpp | 27.8Vpp |
| 120µF | 96µF | 27.8Vpp | 23.0Vpp | 23.2Vpp |
Under the approximation criteria, 82µF exceeds the 50Hz·40Vpp target, whereas 100µF satisfies it. Applying the effective capacitance of 80µF for the 100µF candidate yields an approximate 50Hz ripple of about 33.8Vpp and a minimum voltage of about 244.2V. At 60Hz, the recharge interval becomes shorter, reducing the ripple. The simulated values in the table reflect the circuit conditions described in the next section.
4. How Much Do Circuit Waveforms Differ from Calculated Values?
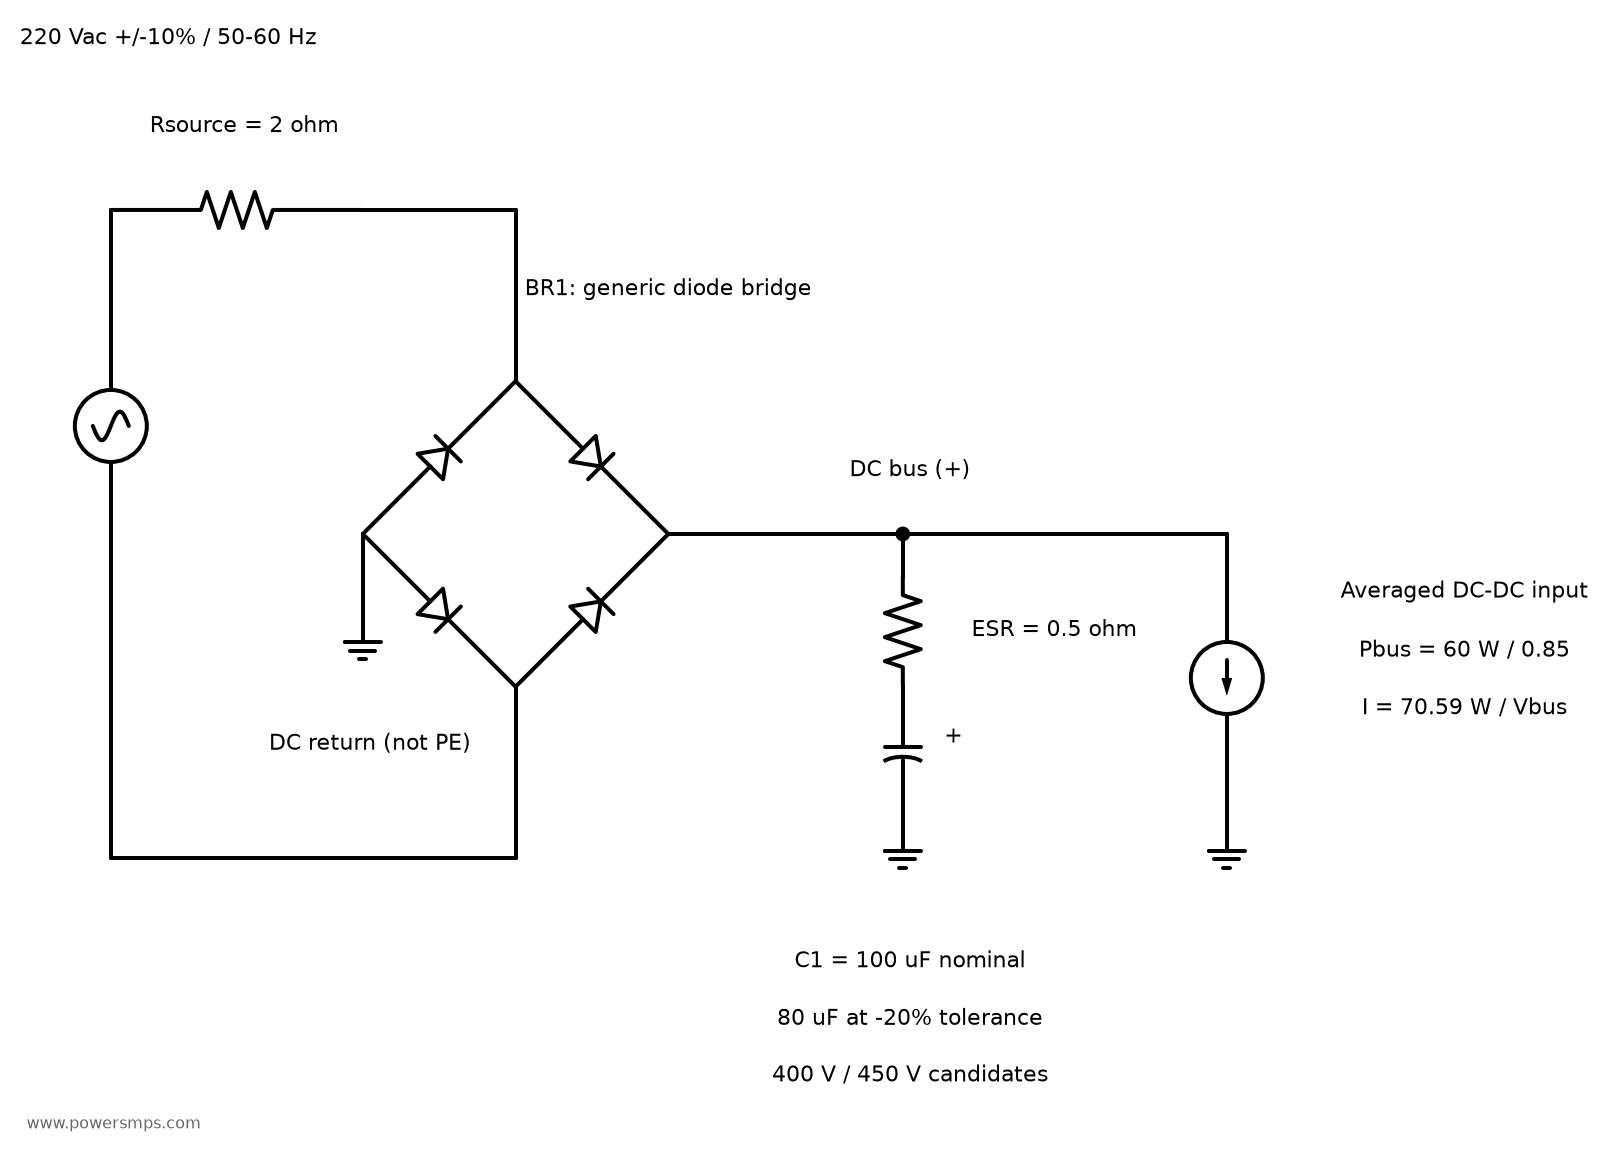
The waveforms below show transient simulation results of the bridge rectifier circuit performed in ngspice. The input source resistance is assumed to be 2Ω, and the capacitor ESR is assumed to be 0.5Ω. All four diodes use the same generic model. The model parameters are IS=5nA, N=1.8, RS=0.1Ω, BV=1000V, and IBV=10µA. Rather than being restricted to specific commercial components, the modeling is intended to verify fundamental circuit behavior.
The load is an averaged constant-power model with \(I_{\mathrm{load}}=70.59/V_{\mathrm{bus}}\). To ensure startup calculation stability, the denominator was clamped below 200V, and the load was ramped up gradually over 50~55ms. The results were evaluated during the steady state at 0.5~0.6 seconds. In this interval, it was verified that the bus remains above 200V and load power maintains its setpoint. The maximum simulation timestep is 20µs. Behavioral sources and transient analysis methods can be referenced in the ngspice manual.
| 198Vac · 50Hz · Effective 80µF Parameter | Simulation Result |
|---|---|
| Maximum Bus Voltage | Approx. 277.1V |
| Minimum Bus Voltage | Approx. 249.3V |
| Bus Ripple | Approx. 27.8Vpp |
| Capacitor Low-Frequency Ripple Current | Approx. 0.654Arms |
| Bridge Output Peak Charging Current | Approx. 2.43A |
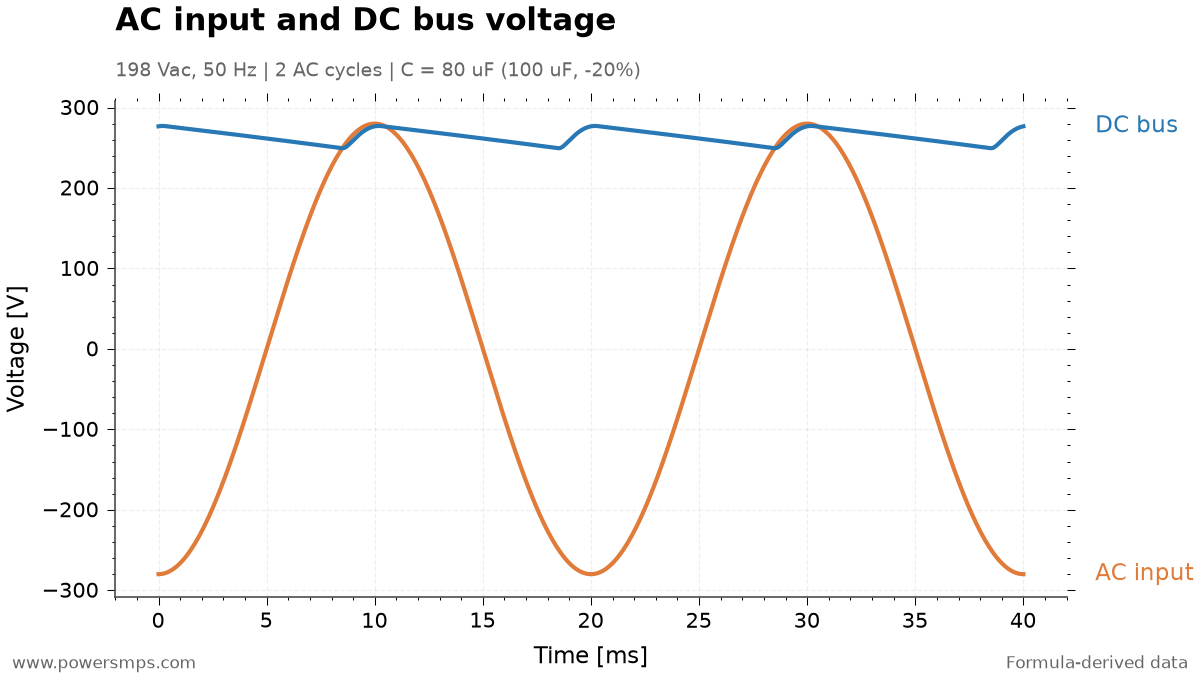
The simulated circuit value of 27.8Vpp is smaller than the simple calculated value of 33.8Vpp. This occurs because the rectifier conducts for a finite interval to supply the load and charge the capacitor, resulting in a shorter discharge duration than the calculation that assumes discharge over the entire half-cycle. Conversely, source resistance and diode forward drops reduce the achievable peak voltage. ST AN1262 also takes rectifier conduction time into account when evaluating input bulk capacitance and minimum bus voltage.
Even if the 82µF candidate falls within 40Vpp in circuit simulation, adopting it immediately is premature. The resistance and diode parameters here are assumed values. It is safer to select the initial candidate using a conservative 1st-order calculation and then refine it using models and measurements reflecting actual components and operating conditions.
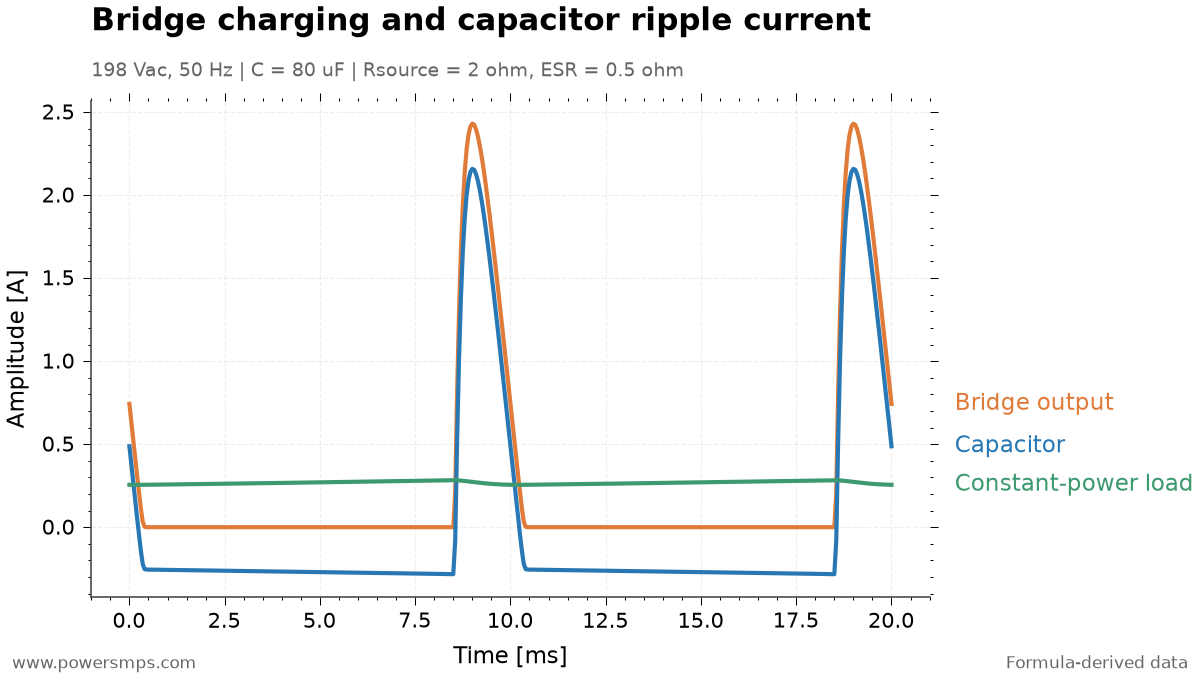
The capacitor current is \(i_C=i_{\mathrm{bridge}}-i_{\mathrm{load}}\). It delivers current to the load during discharge and receives pulsating currents during charging. Therefore, allowable ripple current for the capacitor cannot be evaluated solely from the load current. The RMS value above represents the low-frequency component calculated as \(I_{C,\mathrm{rms}}=\sqrt{(1/T)\int i_C^2dt}\). The averaged load model does not include the high-frequency switching current of the DC/DC converter.
5. Voltage Rating and Ripple Current Are Verified Separately
At the high line input of 242Vac, the no-load peak calculated without diode forward drop is \(V_{\mathrm{pk,max}}\approx242\sqrt{2}=342.2\,\mathrm{V}\). Based on this steady-state voltage, 400V and 450V ratings can be compared as candidates. When determining the actual voltage rating, surge margins, voltage derating guidelines, and operating temperature must be comprehensively evaluated in addition to the steady-state peak.
Ripple current ratings must be compared against the datasheet frequency and temperature specifications. A simple calculation of only the low-frequency ESR loss in this model gives \(P_{\mathrm{ESR}}\approx0.654^2\times0.5\approx0.214\,\mathrm{W}\). Actual dissipation must also account for frequency-dependent ESR and high-frequency current components. Temperature and lifetime considerations can be explored further in the article on smoothing capacitor lifetime, thermal management, layout, and venting. When increasing capacitance, startup inrush current and rectifier stress must also be verified.
The ripple target must also be distinguished from holdup time. The 10ms in this 50Hz calculation is the periodic interval between rectification peaks. This differs from the requirement of maintaining output for 20ms following an AC line dropout. Holdup is evaluated separately using \(t_{\mathrm{hold}}\approx C_{\mathrm{eff}}(V_{\mathrm{start}}^2-V_{\mathrm{stop}}^2)/(2P_{\mathrm{bus}})\), which must incorporate the case where power drops out at the worst-case ripple valley and the downstream converter’s actual minimum operating voltage.
6. Selection Results for This Example
Under the conditions of 220Vac ±10%, 60W, DC/DC efficiency of 85%, 50/60Hz, and allowable ripple of 40Vpp, 100µF can be selected as the initial capacitance candidate. With an effective capacitance of 80µF reflecting the −20% tolerance, the approximate 50Hz ripple is about 33.8Vpp, and the circuit simulation value is about 27.8Vpp.
After determining the 1st candidate capacitance by calculation, the criteria to check when finalizing component selection are as follows.
- Verify that at low line (198Vac), the ripple valley remains above the minimum input voltage of the downstream DC/DC converter.
- Determine a voltage rating (400V or 450V) that satisfies surge margins and derating standards based on the high line (242Vac) no-load peak voltage (342.2V).
- Check whether temperature rise due to low-frequency ripple and high-frequency switching components, as well as startup inrush current, can be tolerated.
Leave a Reply