When selecting a capacitor, capacitance and voltage rating are the first values that catch the eye. However, components with the same capacitance and voltage rating can exhibit vastly different ripple current handling capabilities and frequency characteristics. To correctly choose components for power supply circuits, one must clearly distinguish what capacitance, voltage rating, ESR, and ripple current each describe.
Capacitors are also commonly referred to as condensers. This article first reviews charge-discharge principles and fundamental formulas, then examines criteria for reading actual electrolytic capacitor datasheet specifications. Detailed capacitance sizing and lifetime calculations for smoothing capacitors are covered sequentially in subsequent practical guides.
Table of Contents
- 1. Capacitors Store and Release Electric Charge
- 2. Capacitance Determines How Fast Voltage Changes
- 3. Voltage Rating Is Compared with Actual Maximum Applied Voltage
- 4. ESR and Ripple Current Jointly Determine Heat Generation
- 5. Real Components Are Also Influenced by Frequency and Applied Voltage
- 6. Reading a Datasheet Line Down to Its Operating Conditions
- 7. Connecting Core Metrics to Practical Component Selection
1. Capacitors Store and Release Electric Charge
The fundamental structure of a capacitor consists of two electrodes separated by an insulating dielectric material. When a voltage is applied across the terminals, charges of equal magnitude and opposite polarity accumulate on the electrodes, storing energy within the electric field between them. When capacitance remains constant, the relationship between stored charge and voltage is as follows.
\[Q=CV\]\(Q\) is the charge in coulombs (C), \(C\) is the capacitance in farads (F), and \(V\) is the voltage across the capacitor in volts (V). At the same voltage, a larger capacitance stores more charge. The basic structure and charge-discharge operation can also be reviewed in TDK’s capacitor basics guide.
In power supply circuits, capacitors reduce voltage variations by supplying current when needed and absorbing charge again. While a capacitor supplies current, its stored charge decreases, causing its terminal voltage to drop accordingly. Therefore, one must secure sufficient capacitance to satisfy the allowable voltage drop tolerance required by the circuit.
The statement that ‘capacitors block direct current (DC)’ is easy to understand by considering the steady state once charging is complete. When the voltage across an ideal capacitor is constant, no current flows through that capacitor branch. In practical components, a minute leakage current exists, and its magnitude should be checked according to component type and operating conditions.
A capacitor connected in parallel between a power source and a load does not sever the DC path. The load continuously receives current from the DC source, while the capacitor charges and discharges in the parallel branch to buffer transient voltage fluctuations.
2. Capacitance Determines How Fast Voltage Changes
In an ideal capacitor with constant capacitance \(C\), the relationship between current and voltage change is given by:
\[i(t)=C\frac{dv(t)}{dt}\]That is, for a given current, a larger capacitance results in a slower rate of voltage change. If a constant discharge current \(I\) is supplied for a duration \(\Delta t\), the magnitude of the voltage drop \(\Delta V\) is calculated as follows:
\[\Delta V=\frac{I\Delta t}{C}\]For example, assume a capacitor supplies 0.1A for 100µs. During this interval, the capacitor bears the entire required load current, while ESR, ESL, and power source control loop responses are omitted.
| Capacitance | Assumed Discharge Current | Discharge Duration | Calculated Voltage Drop |
|---|---|---|---|
| 100µF | 0.1A | 100µs | 0.1V |
| 200µF | 0.1A | 100µs | 0.05V |
Under identical discharge conditions, doubling the capacitance cuts the voltage drop in half. This clearly illustrates the fundamental principle that a larger capacitance provides greater buffering capacity to suppress voltage sag.
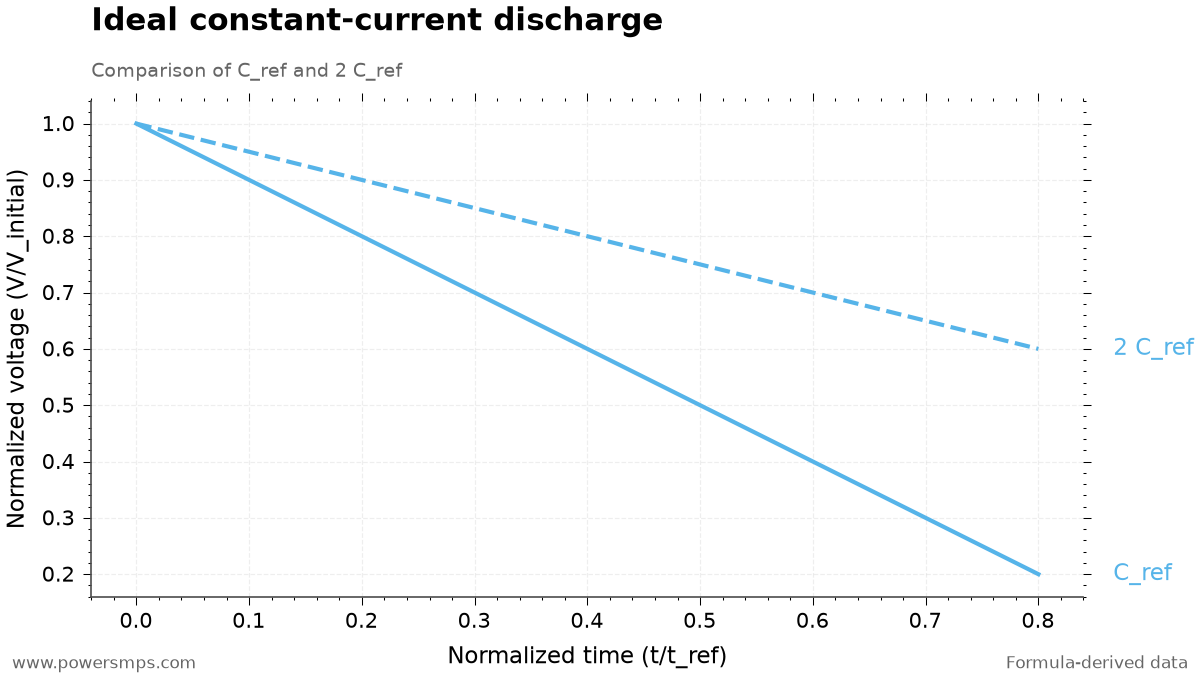
The vertical axis of the graph shows instantaneous voltage normalized to initial voltage. The horizontal axis represents time normalized to a reference duration, defined as the time required for the baseline capacitance to ideally discharge to 0 at the same current. At normalized time 0.2, the voltage of the baseline capacitance is 0.8 of its initial value, while that of the double capacitance is 0.9. This intuitively illustrates how a larger capacitance maintains a more stable voltage over the same duration.
This comparison corresponds to a constant-current discharge model where load current remains fixed. Under resistive loads where current decreases alongside voltage, or constant-power loads where current increases as voltage drops, voltage sag must be analyzed using energy equations tailored to the specific load characteristics.
3. Voltage Rating Is Compared with Actual Maximum Applied Voltage
The rated voltage is the benchmark voltage that can be applied to a capacitor under specified operating conditions. When selecting aluminum electrolytic capacitors for power supplies, one must verify not only the average DC voltage but also the maximum peak voltage including superimposed ripple. The maximum applied voltage to compare against the datasheet rated voltage is as follows:
\[V_{\mathrm{peak}}=V_{\mathrm{DC}}+V_{\mathrm{ripple,peak}}\]Here, \(V_{\mathrm{ripple,peak}}\) represents the upper peak ripple deviation riding on top of the average DC voltage. Only this upper peak value added to the average DC level—not the entire peak-to-peak ripple—must be included to calculate the true maximum voltage accurately. In addition, rated voltage margins should account for input line fluctuations, startup overshoot, and transient voltages resulting from step-load changes.
For polarized aluminum electrolytic capacitors, mounting orientation and potential reverse voltage occurrences must also be checked rigorously. Surge voltage ratings listed in datasheets represent thresholds for short-duration transients, so continuous operating voltages must remain strictly below rated voltage. For detailed permissible conditions, follow manufacturer application guidelines such as the Nichicon Aluminum Electrolytic Capacitors Technical Document.
4. ESR and Ripple Current Jointly Determine Heat Generation
ESR represents internal AC losses of a capacitor as an equivalent series resistance. Its unit is ohms (Ω), and it varies with frequency and temperature. Unlike an ideal capacitor, this metric accounts for conduction and dielectric losses that occur as charge flows into and out of practical components.
Ripple current is the alternating current (AC) component repeatedly flowing into and out of a capacitor. Ripple voltage is the amplitude of voltage fluctuation, whereas ripple current is the AC component of current, so they must be distinguished. Permissible ripple current is the thermal current limit a capacitor can withstand under specified temperature and frequency conditions.
When approximated at a single frequency, power loss \(P\) caused by RMS ripple current \(I_{\mathrm{rms}}\) is calculated as follows:
\[P\approx I_{\mathrm{rms}}^2\times\mathrm{ESR}\]Assuming an ESR of 0.1Ω at the frequency of interest, losses are calculated as follows:
| RMS Ripple Current | Assumed ESR | Calculated Power Loss |
|---|---|---|
| 1A | 0.1Ω | 0.1W |
| 2A | 0.1Ω | 0.4W |
When current doubles, power loss quadruples for the same ESR. This power dissipation converts into internal heating within the can, and final temperature rise is determined by case surface area and surrounding board heat dissipation conditions. When multiple frequency components are present, total loss is evaluated by combining the RMS values of individual harmonics with frequency-dependent ESR. Nichicon Ripple Current and Heat Generation Overview
Directly substituting DC load current for capacitor ripple current introduces large errors. This is because current actually flowing through the capacitor is an AC component dictated by charge-discharge paths in the switching circuit. Therefore, one must first determine the RMS branch current of the capacitor via circuit analysis or simulation, then compare it against rated ripple current adjusted by frequency and temperature correction factors from the datasheet.
5. Real Components Are Also Influenced by Frequency and Applied Voltage
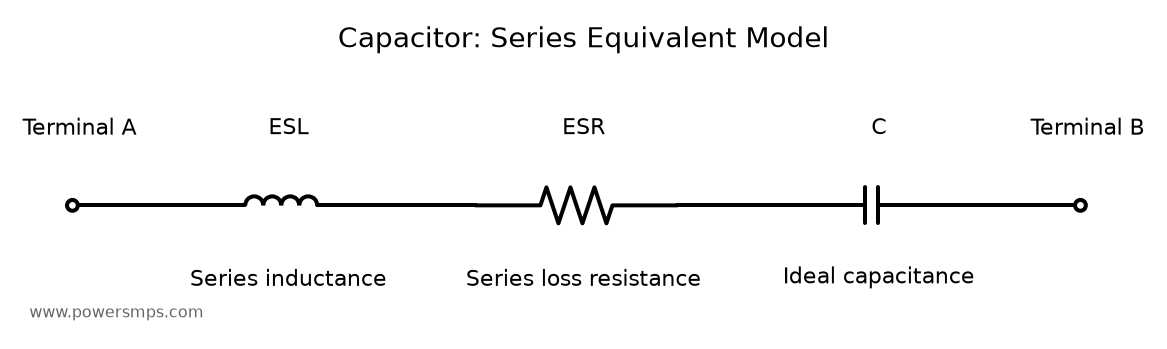
Practical capacitors contain not only ESR but also equivalent series inductance (ESL) arising from internal electrode geometry and terminal leads. Because of this, impedance does not decrease indefinitely as frequency increases. Impedance reaches a minimum near the self-resonant frequency (SRF), beyond which inductance dominates and inductive behavior emerges.
Impedance is the combined magnitude of total AC resistance and reactance. At the self-resonant point, reactances cancel out and impedance approaches ESR, but across other frequency bands, impedance is significantly larger. Therefore, impedance magnitude and ESR in datasheets must be distinguished as separate physical quantities, and measurement frequency conditions for each parameter must be verified together. Murata’s Overview of Impedance and ESR Frequency Characteristics
Effective capacitance likewise cannot be evaluated solely from the nominal marked value. In multilayer ceramic capacitors (MLCCs) in particular, capacitance variation under applied DC voltage depends heavily on the dielectric material.
| Dielectric Type | Representative Code | Considerations Under Applied DC Voltage |
|---|---|---|
| High Dielectric Constant Ceramic | X5R, X7R | Effective capacitance can decrease significantly due to DC bias; verify individual part characteristic curves. |
| Temperature-Compensating Ceramic | C0G | Does not exhibit capacitance drop due to DC bias. |
Therefore, for X5R and X7R components, one must compare the effective remaining capacitance at actual operating voltage, even when nominal capacitances are identical. Rather than relying on arbitrary reduction ratios, verify the actual derating from manufacturer DC bias characteristic curves, and combine initial tolerance with temperature-induced variations to validate worst-case conditions. Murata MLCC DC Bias FAQ
6. Reading a Datasheet Line Down to Its Operating Conditions
Using UPW0J471MPD from the Nichicon UPW Series Datasheet as an example, let us examine the criteria for reading an actual specification table.
| Parameter | Datasheet Value | Conditions to Verify Together |
|---|---|---|
| Rated Voltage | 6.3V | Verify against maximum applied voltage including ripple and product operating conditions. |
| Nominal Capacitance | 470µF | Capacitance tolerance is ±20%; test conditions are 20°C and 120Hz. |
| Case Dimensions | Diameter 8mm × Height 11.5mm | Compare against actual mounting space. |
| Maximum Impedance | 0.117Ω | Value specified at 20°C and 100kHz; distinguish from ESR specifications. |
| Rated Ripple Current | 555mArms | Specified under 105°C and 100kHz conditions. |
| Endurance Test Duration | 3,000 hours | Review the 105°C test conditions for the given case diameter and post-test acceptance criteria together. |
First, 0.117Ω is the maximum impedance guaranteeing an upper bound on high-frequency filtering performance. Rather than substituting this value directly as ESR for thermal loss calculations, it is more appropriate to approach it as the ceiling for high-frequency AC impedance. For rigorous loss evaluation, consult frequency-dependent ESR data or dissipation factor tables provided by the manufacturer.
555mArms is the permissible RMS ripple current rated at 105°C and 100kHz. If actual switching frequency differs from 100kHz, the allowable limit must be converted by multiplying by the datasheet frequency correction factor. Furthermore, because this component has a rated voltage of 6.3V, it is suited for low-voltage step-down circuits or secondary (2nd) output smoothing stages, rather than high-voltage input sections such as direct 220Vac rectification stages.
The endurance test duration of 3,000 hours is a reliability assurance benchmark under the maximum test condition of 105°C with rated ripple current applied. The actual lifetime of non-solid aluminum electrolytic capacitors is heavily governed by ambient temperature and internal heating induced by ripple current. Therefore, expected lifetime at room temperature or under normal operating conditions is estimated by substituting measured component temperatures into the manufacturer’s lifetime calculation formula. Nippon Chemi-Con’s Overview of Electrolytic Capacitor Lifetime
7. Connecting Core Metrics to Practical Component Selection
When reviewing a datasheet, evaluate each parameter by connecting it directly to practical design questions.
| Core Parameter | Selection Criteria |
|---|---|
| Capacitance | Does voltage drop remain within permissible limits during the discharge duration? |
| Voltage Rating | Is adequate voltage margin maintained against peak voltage, including ripple and transients? |
| ESR | Are power loss and heat generation from ripple manageable across the switching frequency band? |
| Permissible Ripple Current | Does calculated or measured RMS ripple current satisfy rated limits under operating frequency and temperature conditions? |
The basic selection procedure for smoothing stages can be explored further in How to Select Smoothing Capacitors.
The process of applying capacitance calculations to practical conditions is covered in 220Vac SMPS Input Smoothing Capacitor Sizing: Calculation and Simulation Examples. Because the 60W example in that article uses constant-power load energy relationships, comparing it against the constant-current discharge discussed here clearly clarifies calculation differences between load models.
To evaluate how long selected components will operate under actual operating temperature and layout conditions, continue reading Smoothing Capacitor Lifetime Calculation: High-Temp PCBA Temperature Measurement, Layout, and Vent Clearance.
Leave a Reply