When selecting a resistor, one must evaluate not only the nominal resistance but also the tolerance, power rating, and temperature coefficient of resistance (TCR). Even for identical resistance values, the prioritized specifications differ across gate drive, current-sense, and voltage divider circuits.
This guide highlights key resistor markings and datasheet specifications, detailing design workflows for gate drive resistors, current-sense shunts, and voltage dividers. Numerical values throughout the text are based on theoretical calculation models to illustrate core operating principles.
Table of Contents
- 1. Resistor Markings and Package Sizes: Interpreting Marking Codes and Physical Dimensions
- 2. Reading Resistance, Tolerance, Power Rating, and TCR
- 3. [Practical Application 1] Gate Drive Resistor (Rg): Balancing Ringing Suppression and Switching Losses
- 4. [Practical Application 2] Current-Sense Shunt Resistors: Kelvin Connections, Power Dissipation, and Error Analysis
- 5. [Practical Application 3] Voltage Dividers: Worst-Case Error Analysis and Loading Effects
- 6. Comparison of Resistor Selection Criteria Across 3 Key Applications and Practical Design Checklist
1. Resistor Markings and Package Sizes: Interpreting Marking Codes and Physical Dimensions
Correctly decoding component surface markings and package dimensions is the starting point for component selection.
SMD Chip Resistor Markings and the Decimal Point ‘R’ Notation
Representative numerical marking systems for SMD chip resistors are as follows:
- 3-Digit Code (Typically ±5% J-Class): The first two digits represent the significant figures, and the third digit represents the power-of-10 multiplier.
- Example:
103denotes 10 × 10³ = 10,000Ω = 10kΩ, and472denotes 4.7kΩ.
- Example:
- 4-Digit Code (Typically ±1% F-Class): The first three digits represent the significant figures, and the fourth digit represents the power-of-10 multiplier.
- Example:
1001denotes 100 × 10¹ = 1,000Ω = 1kΩ, and4992denotes 49.9kΩ.
- Example:
- Decimal Point ‘R’ Notation: For low-resistance ratings, the letter ‘R’ designates the decimal point position in ohms (Ω).
- Example:
4R7denotes 4.7Ω, andR010denotes 0.010Ω (10mΩ).
- Example:
Certain compact precision 1% chip resistors use the EIA-96 marking scheme. It consists of a 2-digit numerical code (a unique significant value lookup) combined with a 1-letter alphabetic character (multiplier); because this differs completely from standard decade multipliers, a dedicated lookup table must be referenced.
Leaded Color Bands and Tolerance Letter Codes
Leaded resistors are read by color bands. A 4-band resistor consists of ‘2 significant figures, multiplier, tolerance’; for example, a combination of Brown (1), Black (0), Red (10²), and Gold (±5%) represents 1kΩ ±5%. A 5-band resistor displays 3 significant figures. In part numbers, common tolerance code letters include F (±1%) and J (±5%).
Leaded Resistor Color Code Reference Table
| Color | Significant Figures | Multiplier | Tolerance |
|---|---|---|---|
| Black | 0 | 10⁰ | — |
| Brown | 1 | 10¹ | ±1% |
| Red | 2 | 10² | ±2% |
| Orange | 3 | 10³ | ±0.05% |
| Yellow | 4 | 10⁴ | — |
| Green | 5 | 10⁵ | ±0.5% |
| Blue | 6 | 10⁶ | ±0.25% |
| Violet | 7 | 10⁷ | ±0.1% |
| Gray | 8 | — | — |
| White | 9 | — | — |
| Gold | — | 10⁻¹ | ±5% |
| Silver | — | 10⁻² | ±10% |
| No Band | — | — | ±20% |
A 4-band resistor applies the multiplier after two digits, whereas a 5-band resistor applies the multiplier after three digits. Gold and silver are not read as significant figures. An em dash (—) in the table indicates that the parameter was not specified in the KOA documentation. Because colors for precision tolerances can vary across manufacturers and product series, verify specifically orange and gray bands against the applicable datasheet. Source: KOA Resistor Marking Methods.
Package Dimension Notations: Avoiding Imperial and Metric Confusion
The imperial designation 0603 (0.06 × 0.03 inch) and metric designation 1608 (1.6 × 0.8 mm) refer to the same physical package size. Confusing these unit systems when navigating datasheets and CAD footprint libraries causes assembly and placement errors.
Chip Resistor Imperial vs. Metric Dimension Comparison Table
| Imperial Size | Metric Size | Dimensions Length × Width (mm) |
|---|---|---|
| 01005 | 0402 | 0.4 × 0.2 |
| 0201 | 0603 | 0.6 × 0.3 |
| 0402 | 1005 | 1.0 × 0.5 |
| 0603 | 1608 | 1.6 × 0.8 |
| 0805 | 2012 (2125) | 2.0 × 1.25 |
| 1206 | 3216 | 3.2 × 1.6 |
| 1210 | 3226 (3225) | 3.2 × 2.6 |
| 2010 | 5025 | 5.0 × 2.5 |
| 2512 | 6331 (6432) | 6.3 × 3.1 (6.4 × 3.2) |
Identical numeric codes indicate vastly different sizes depending on the unit system. For example, imperial 0603 corresponds to metric 1608, whereas metric 0603 corresponds to imperial 0201. Package size codes represent nominal envelope dimensions and are not exact conversions or PCB pad footprint dimensions. Because exact dimensions, tolerances, and designations vary by manufacturer and series, consult the respective datasheet for ordering and PCB footprint design. Source: KOA Resistor Package Sizes.
Power ratings and TCR cannot be determined from surface markings or physical package sizes alone. Because allowable specifications vary widely across series even within the same 0603 package size, verify the official datasheet based on the manufacturer’s exact part number.
- Primary Sources (1): KOA Resistor Marking and Tolerance Codes, Bourns CR Series Chip Resistor Datasheet (EIA-96 Marking)
2. Reading Resistance, Tolerance, Power Rating, and TCR
Resistor datasheets must be read by simultaneously evaluating resistance, tolerance, power rating, and temperature coefficient of resistance (TCR). Because power ratings depend on temperature and mounting conditions, the derating curve must also be reviewed.
| Specification | Meaning and Units | Key Considerations |
|---|---|---|
| Resistance | Nominal resistance, Ω · kΩ · mΩ | Verify that it produces the required voltage drop, current, or divider ratio |
| Tolerance | Allowable deviation from nominal value under manufacturer reference conditions, % | Distinguish initial tolerance from operational temperature-induced variation |
| Power Rating | Continuous power dissipation capability under specified conditions, W | Compare calculated losses against derated allowable power based on temperature and PCB conditions |
| Temperature Coefficient (TCR) | Relative rate of change in resistance with temperature, ppm/°C | Verify temperature variations across the operating range, including self-heating effects |
Tolerance represents the initial manufacturing deviation of resistance, whereas TCR represents the additional resistance change that occurs as temperature shifts. A low TCR does not automatically imply a tight initial tolerance, so both specifications must be calculated independently. 1 ppm represents one part per million, or \(10^{-6}\).
Derating is the criterion for reducing allowable power dissipation as temperature rises. Because the reference rating temperature and derating slope vary across components, first determine whether the derating curve is referenced to ambient temperature, terminal temperature, or case temperature, and follow the mounting conditions in the datasheet.
Continuous operating voltage must remain at or below the lower of the following two limits:
\[V_{\mathrm{work}} \leq \min\left(\sqrt{P_{\mathrm{allowed}}R}, V_{\mathrm{limit}}\right)\]\(P_{\mathrm{allowed}}\) is the allowable power under actual operating conditions, and \(V_{\mathrm{limit}}\) is the maximum continuous working voltage specified in the datasheet. Pulse withstand ratings must be verified separately from continuous power and voltage ratings.
Worked Calculation Example: Combined Tolerance and TCR Error with Power Dissipation
Consider a component with nominal resistance 10kΩ (±1%) and TCR = ±100ppm/°C subjected to a temperature rise of ΔT = 60°C (including self-heating) during operation:
- Initial manufacturing tolerance range: 10kΩ × (1 ± 0.01) = 9.9kΩ to 10.1kΩ
- Temperature-induced variation based on the linear model \(R(T)=R(T_0)[1+\alpha(T-T_0)]\): alpha × ΔT = ±100 × 10⁻⁶ × 60 = ±0.006 = ±0.6%
- Conservative 1st-order linear summation with initial tolerance ±1%: approximately ±1.6%
- Worst-case deviation based on multiplicative bounds:
- Maximum: 1.01 × 1.006 = 1.01606 (+1.606%)
- Minimum: 0.99 × 0.994 = 0.98406 (-1.594%)
Power dissipation is calculated using the following equation:
\[P=VI=I^2R=\frac{V^2}{R}\] In constant-voltage circuits, power dissipation increases with lower resistance, whereas in constant-current circuits, power dissipation increases with higher resistance. When a voltage of 10V is applied across a 1kΩ resistor, power dissipation is P = 10² / 1000 = 0.1W (100mW). Even when using a nominally rated 0.25W component, elevated board temperature causes allowable power to drop sharply along the derating curve. Rather than relying solely on empirical ‘50% derating rules of thumb’, check actual operating temperatures and datasheet curves to ensure adequate safety margin.
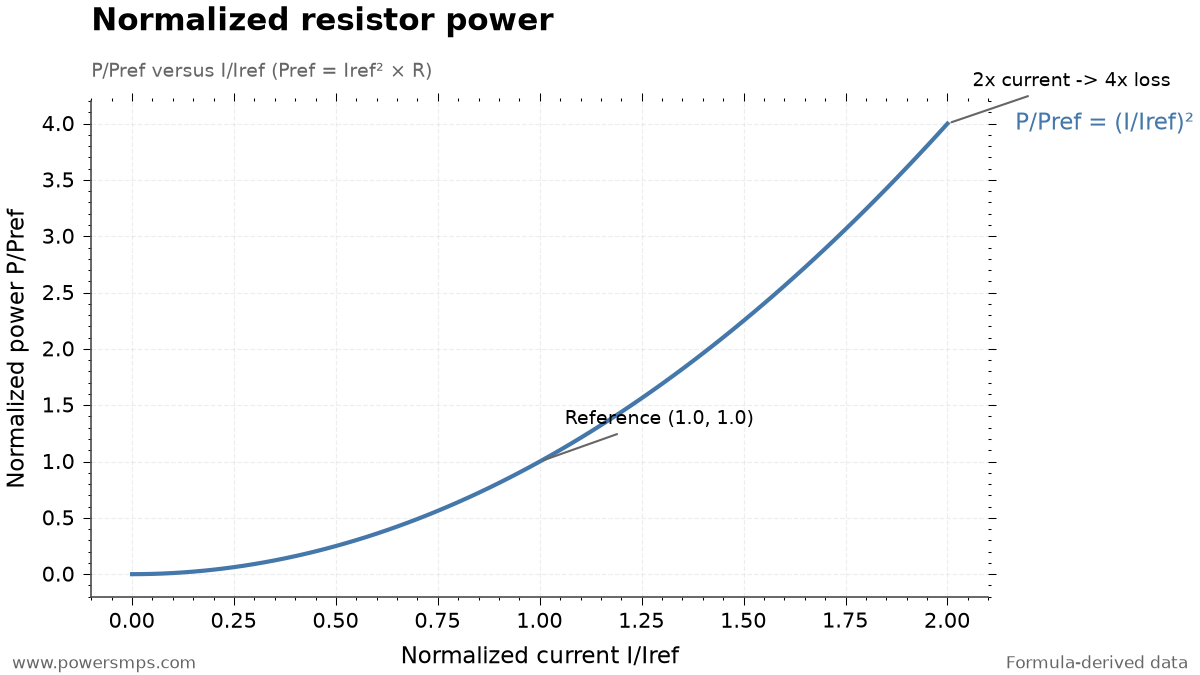
As current flowing through a fixed resistor increases, power dissipation surges in proportion to the square of the current (I²). The graph above is an educational normalized curve based on the mathematical model (y = x²); when current increases by a factor of 2, power loss increases by a factor of 4.
- Primary Sources (1): Bourns Resistor FAQ (Definitions of Tolerance, TCR, and Power Rating)
3. [Practical Application 1] Gate Drive Resistor (Rg): Balancing Ringing Suppression and Switching Losses
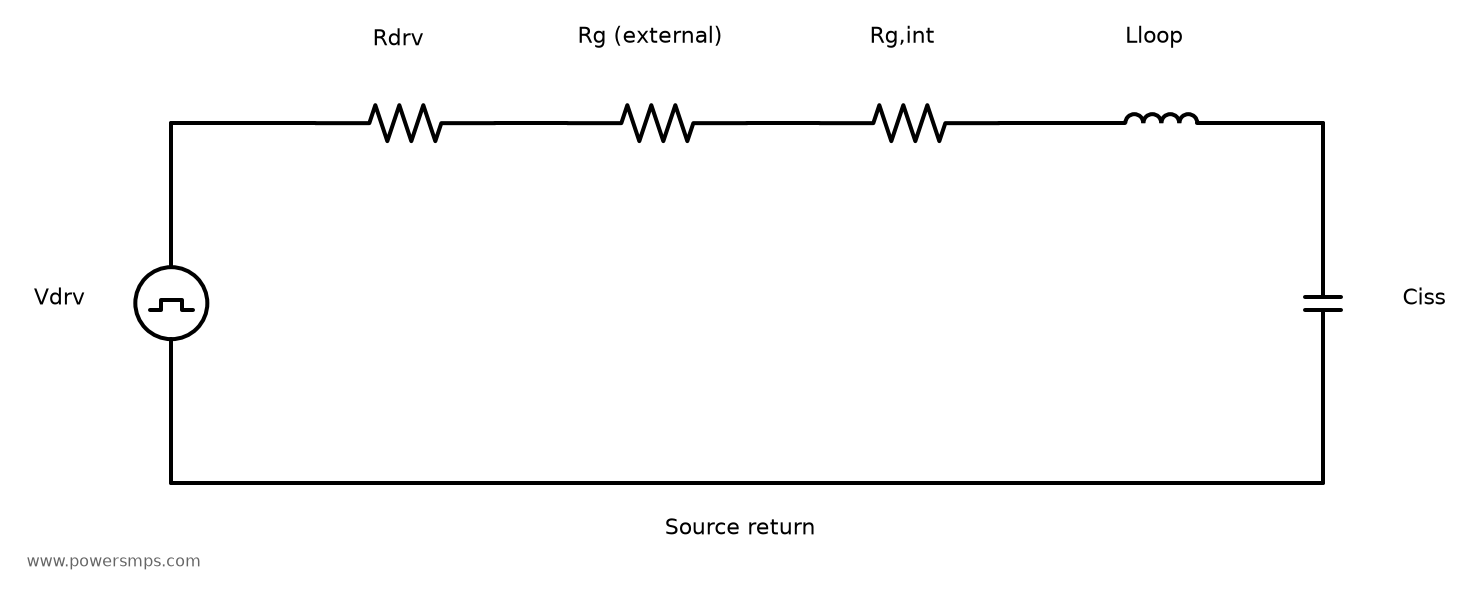
The external gate resistor (Rg) connected in series with the gate terminal of a power MOSFET dictates both the efficiency and noise performance of switching power supplies.
Drive Loop Operating Principle and Switching Trade-offs
The gate drive loop is formed by the series connection of driver output impedance, external gate resistance (Rg), and the MOSFET internal gate resistance. These resistive elements, along with PCB trace parasitic inductance (L) and MOSFET input capacitance (Ciss), form an RLC resonant circuit.
The external gate resistor acts as the damping resistance for this RLC resonance, controlling charging and discharging transition speeds (dv/dt, di/dt).
- Increasing Rg generally slows down transitions and aids in damping gate loop ringing. However, switching losses may increase, and EMI variations must be evaluated using measured waveforms under actual circuit conditions.
- Decreasing Rg can accelerate switching transitions, but may exacerbate overshoot and ringing.
There is no single universal resistor value that applies to all circuits; the optimum resistance represents a design compromise based on gate driver drive capability, MOSFET parameters, PCB parasitic elements, and empirical waveforms. Further details on drive circuit design can be found in the article 3.3V MCU Relay Driver MOSFET Selection: On-Resistance, Gate Resistor, and Voltage Rating Calculations.
Peak Current Approximate Calculation and Key Design Precautions
In a purely resistive simplified approximation with driver supply 10V, driver internal resistance 2Ω, external Rg = 10Ω, and MOSFET internal resistance 1Ω, the total series resistance is 13Ω. The initial peak charging current at the onset of switching is as follows: \[I_{\mathrm{peak}} \approx \frac{10\,\mathrm{V}}{13\,\Omega} \approx 0.769\,\mathrm{A}\]
This calculation is a simplified approximation that neglects parasitic inductance L and gate driver current limiting.
When evaluating gate resistors, the most critical mistake to avoid is substituting the main circuit load current (I_load) into the loss equation as I_load² × Rg. The gate charge/discharge current flowing through the gate resistor follows an entirely different path from the main load current. Furthermore, rather than determining average power and part rating solely from the simplified Qg × V × fsw formula without detailed waveform integration, verify the manufacturer’s pulse rating to ensure withstand capability against instantaneous peak pulse currents.
- Primary Sources (1): TI External Gate Resistor Design Guide (SLLA385A)
4. [Practical Application 2] Current-Sense Shunt Resistors: Kelvin Connections, Power Dissipation, and Error Analysis
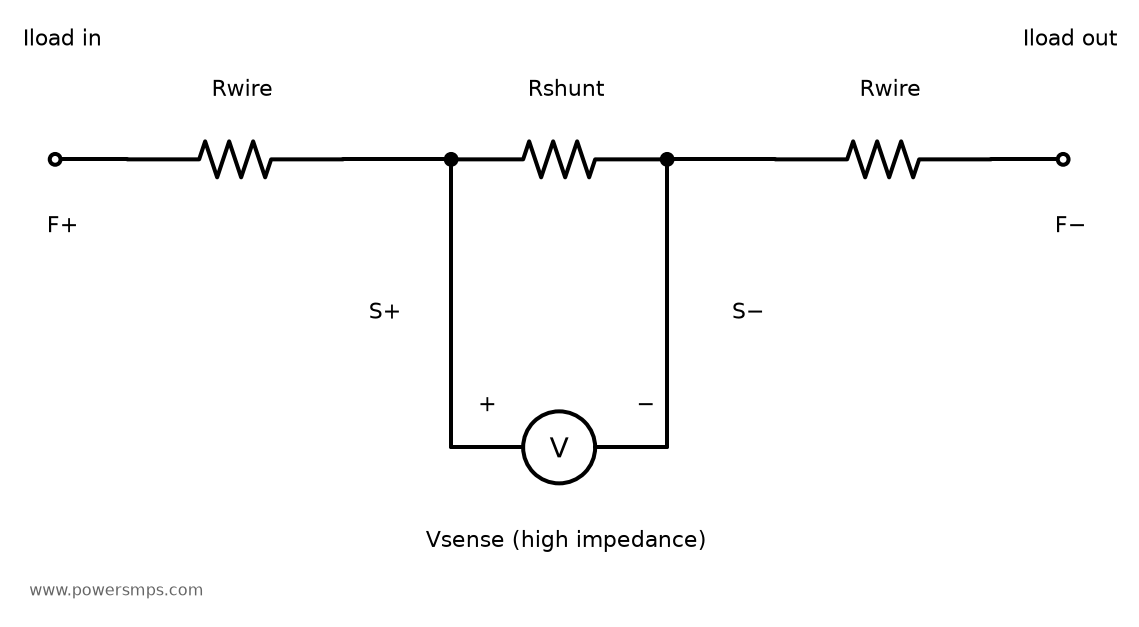
Placing a shunt resistor in series with a current-carrying path generates a differential voltage proportional to the current flow according to Ohm’s law (Vsense = I × Rshunt).
Trade-off Between Signal Amplitude and Thermal Dissipation
Selecting a smaller shunt resistance reduces I²R thermal dissipation, but the resulting smaller sense signal increases the relative measurement error caused by amplifier input offset voltage. Conversely, increasing the resistance yields a larger sense signal that diminishes the relative impact of offset, but results in greater voltage drop and thermal dissipation for the same current.
Consider the operating behavior of a 10mΩ shunt resistor:
- At 5A: Vsense = 5A × 0.010Ω = 50mV, Ploss = 5² × 0.010Ω = 0.25W
- At 10A (2× current): Vsense = 10A × 0.010Ω = 100mV, Ploss = 10² × 0.010Ω = 1.0W
For a fixed resistance, increasing the current by a factor of 2 causes power dissipation to increase by a factor of 4.
Parasitic Trace Resistance and Kelvin 4-Terminal Connection
If a 1mΩ parasitic resistance from PCB copper traces or solder contact resistance is introduced in series with the voltage detection path of a 10mΩ shunt, an additional error of 10% (1mΩ / 10mΩ) occurs from resistance deviation alone.
To eliminate this error, one must implement a Kelvin connection (4-terminal sensing) that isolates the main current-carrying path (Force) from the voltage measurement path (Sense). Because only minimal input bias current flows through the Sense traces, the voltage drop across trace and contact resistances caused by the main current is excluded. The point where sense traces branch off must also conform to manufacturer layout guidelines.
For a shunt with ±50ppm/°C TCR subjected to a 80°C temperature rise, the resistance variation is ±50 × 10⁻⁶ × 80 = ±0.4%, yielding an approximate simple linear sum of ±1.4% when combined with an initial tolerance of ±1%. However, overall current measurement accuracy requires a comprehensive evaluation encompassing amplifier offset, gain error, and ADC reference voltage (Vref) error in addition to shunt tolerance. In low-side sensing, ground bounce—where the load ground potential rises relative to system GND due to shunt voltage drop—must also be evaluated.
- Primary Sources (1): TI Current Sense Amplifiers: Shunt Resistor and Kelvin Connection Guidelines (SBOA170D)
5. [Practical Application 3] Voltage Dividers: Worst-Case Error Analysis and Loading Effects
Voltage dividers are fundamental to feedback sensing, yet designer analysis must account for tolerance combinations and downstream loading errors. Consider a circuit with Vin = 12V, top resistor R1 = 30kΩ, and bottom resistor R2 = 10kΩ:
No-Load Output Voltage and Power Dissipation
Under no-load conditions, the nominal output voltage, divider current, and power dissipation are as follows:
- Vout = 12V × 10kΩ / (30kΩ + 10kΩ) = 3.0V
- Idiv = 12V / 40kΩ = 0.3mA
- R1 power dissipation: (0.3mA)² × 30kΩ = 2.7mW
- R2 power dissipation: (0.3mA)² × 10kΩ = 0.9mW (Total 3.6mW)
Worst-Case Tolerance Combination Error Analysis
When R1 and R2 each possess independent ±1% tolerances, the worst-case output voltages are calculated as follows:
- Vout_max (R2 = 10.1kΩ, R1 = 29.7kΩ): 12V × 10.1 / (29.7 + 10.1) = 12 × 10.1 / 39.8 ≈ 3.045226V (+1.508%)
- Vout_min (R2 = 9.9kΩ, R1 = 30.3kΩ): 12V × 9.9 / (30.3 + 9.9) = 12 × 9.9 / 40.2 ≈ 2.955224V (-1.493%)
In this example, even though both resistors have ±1% tolerances, the output voltage error does not evaluate to a simple ±1% or a direct sum of ±2%; instead, it exhibits an asymmetric deviation (+1.508% / -1.493%) governed by the voltage division ratio.
Loading Effect (Loaded Divider) and Thevenin Equivalent Circuit
Consider a load resistance RL = 100kΩ connected in parallel across the output terminal of the divider:
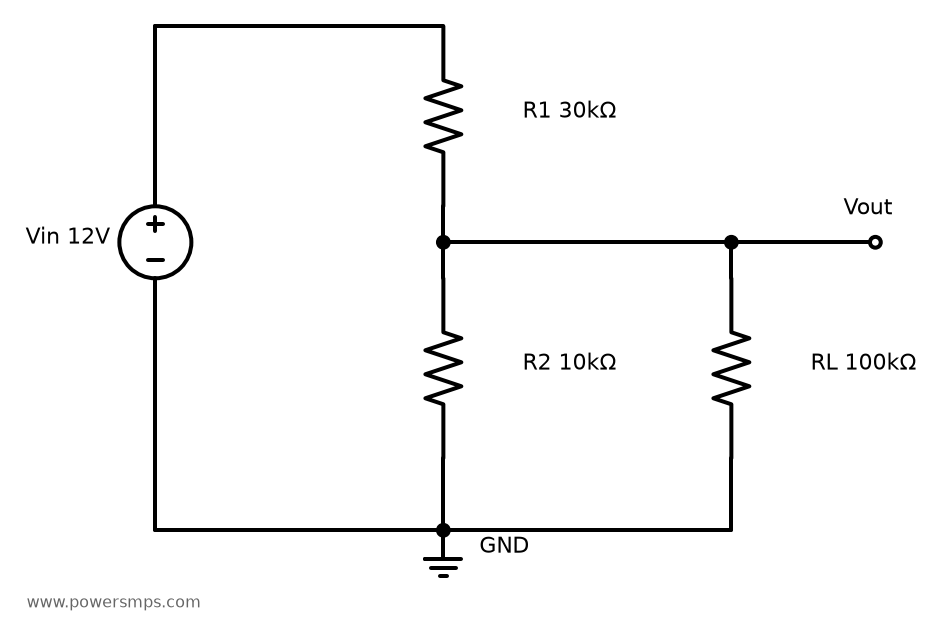
When the load is attached, the effective bottom resistance decreases to the parallel combination of R2 and RL: R2,eff = R2 || RL = (10kΩ × 100kΩ) / (10kΩ + 100kΩ) ≈ 9.090909kΩ
The actual loaded output voltage becomes: Vout,loaded = 12V × 9.090909 / (30 + 9.090909) ≈ 2.790698V Compared to the unloaded 3.0V, the voltage drop is (2.790698 – 3.0) / 3.0 ≈ -6.98%.
From the perspective of Thevenin equivalent resistance Rth = R1 || R2 = 30kΩ || 10kΩ = 7.5kΩ, the internal impedance of 7.5kΩ forms a subsequent divider with the 100kΩ load, inducing a voltage drop of approximately 7%.
Even when two discrete resistors share identical ±TCR ratings, manufacturing variance and temperature differences mean tracking cannot be guaranteed, so the divider ratio cannot be assumed constant across temperature. Furthermore, an ADC input cannot be modeled purely as a single fixed resistor. Review sampling capacitance, acquisition time, and leakage currents, and verify that ADC input limits are preserved across maximum input voltages and resistor tolerances.
6. Comparison of Resistor Selection Criteria Across 3 Key Applications and Practical Design Checklist
The table below summarizes and compares core selection criteria across each application:
Comparison Table of Resistor Selection Criteria for the 3 Key Applications
| Application Field | Primary Circuit Role | Key Required Specifications | Recommended Component & Layout Strategy | Design Pitfalls to Avoid |
|---|---|---|---|---|
| Gate Resistor (Rg) | Damps MOSFET switching ringing and controls transition slew rate (dv/dt) | Pulse withstand capability, suitable resistance value (Ω), low parasitic L | Place in closest proximity between driver and gate pin; cross-check repetitive pulse ratings | Substituting main load current (I_load) into loss equations; blindly assuming a single universal resistor value |
| Current-Sense Shunt | Measures voltage drop across current-carrying path (I -> V conversion) | Resistance that produces the required sense voltage, tolerance and TCR, allowable power under thermal conditions | Dedicated Kelvin 4-terminal layout, adequate heat-dissipating copper planes | Neglecting parasitic trace resistance (2-terminal wiring), poor trade-off between I²R heating and SNR |
| Voltage Divider | Scales input voltage and senses feedback voltage | Tolerance aligned with target accuracy, TCR and ratio stability, operating voltage rating | Simultaneously evaluate loading error, power dissipation, ADC settling time, and input limits | Ignoring loading effect (RL) resulting in voltage droop; overestimating tracking between discrete components with identical TCR |
6-Point Design Checklist for Practical Engineers
- Package Size vs. Part Number Cross-Check: Did you cross-reference the datasheet by exact part number rather than estimating power rating and TCR solely from package size (0603/1608) or surface markings?
- Operating Temperature Derating Verification: Did you calculate allowable derated power at the maximum operating temperature instead of relying on the 50% rule of thumb?
- Maximum Operating Voltage Limit Check: Does the applied voltage stay strictly within \(\sqrt{P_{\mathrm{allowed}}\times R}\) and the manufacturer’s maximum continuous working voltage limit?
- Shunt Resistor Kelvin Routing Check: When designing low-resistance shunts, did you clearly separate Force and Sense copper traces directly at the component pads?
- Divider Thevenin Impedance and Loading Effect Check: Did you calculate the output voltage droop error caused by downstream load resistance or ADC input impedance?
- Gate Resistor Repetitive Pulse Rating Check: Did you verify the resistor’s pulse withstand rating against switching peak currents?
For further practical analysis on passive component selection and switching drive circuits, refer to the following articles:
Leave a Reply