Affiliate Disclosure: This post contains AliExpress affiliate links. If you make a purchase through these links, the author may receive a commission.
Table of Contents
1. Running Anima on ROCK 5C 8GB
With 8GB of memory, the Radxa ROCK 5C 8GB single-board computer (SBC) was used to verify on-device execution of a multi-billion-parameter Diffusion Transformer (DiT) model.
The main processor of the board is a Rockchip RK3588S2 SoC, and its dedicated Rockchip NPU runtime target is rk3588. In the same manufacturer’s Radxa ROCK 5C product line, the Lite model with the RK3582 option uses a different chipset with scaled-down NPU units and CPU core configurations. Therefore, to reproduce this 8GB DiT compute pipeline, one must verify the RK3588S2-based ROCK 5C 8GB model.
The DiT responsible for Anima’s image generation consists of 28 blocks. In this experiment, we partitioned and converted it into a format executable on the NPU of the ROCK 5C.
The fixed I/O specifications for the on-device conversion are as follows: – Batch size: 1 – Generation resolution: 512×512 pixels – Input token specification: 1024 image tokens, 512 text conditioning tokens – Target ONNX version: Opset 19
Qwen3 was used for text encoding, and Qwen-Image VAE was used for image reconstruction. In this configuration, the primary DiT compute is handled by the NPU, while text encoding and VAE decoding are handled by the CPU.
2. Why the DiT Was Partitioned into 84 RKNN Models
Packaging all 28 blocks of the DiT architecture into a single monolithic RKNN model ran into structural limitations of the RKNN compiler. In our 2026-8 experiments using the RKNN-Toolkit2 2.3.2 environment, compiling the entire DiT block or building branches combined with AdaLN (Adaptive Layer Normalization) operations caused a native segfault (exit 139).
Decomposing the graph down to minimal units for debugging revealed that while large Linear layers or standard GELU FFN graphs compiled properly for the NPU target, subgraphs containing the AdaLN LayerNorm + broadcast shift/scale/gate pattern consistently triggered the same segfault regardless of weight size. This confirmed that the issue was not out-of-memory, but a compiler error in parsing specific graph operator patterns.
We separated the 3 compute branches that can execute on the NPU in each DiT block, handling normalization, gating, and residual summation on the CPU.
Each of the 28 DiT blocks was divided into 3 subgraphs: self-attention, cross-attention, and FFN. Self-attention computes relationships between image tokens, cross-attention computes relationships between text conditioning and image tokens, and FFN transforms the features of each token.
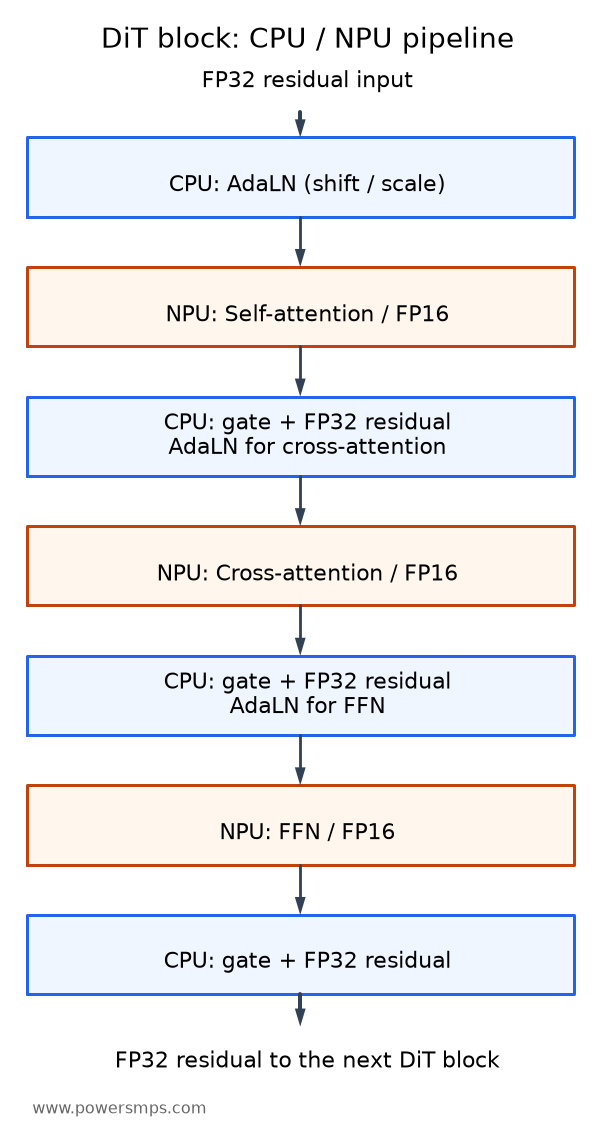
A total of 84 (28 × 3) FP16 RKNN models were generated, totaling approximately 3.99GB in size. AdaLN, gate multiplication, RoPE, input/timestep embeddings, and final projection were executed on the CPU. Residual accumulation was maintained in FP32.
- Separate operations to be handled by the CPU from operations to be handled by the NPU in the original model.
- Convert NPU operations into fixed-I/O-shape ONNX graphs and then compile them to RKNN.
- Compare single-block and full-block outputs against the original model before running image generation.
3. How Close Are the Outputs Before and After Conversion
The most critical step in hybrid partitioned conversion is preventing numerical error accumulation across frameworks. We separated verification into single-block validation and sequential cumulative validation across all 28 blocks.
Single-Block Comparison
We compared ONNX and RKNN outputs against the original PyTorch block’s FP16 branch operations and FP32 residual accumulation. This step verifies whether the converted operations produce outputs pointing in the same direction as the original model.
| Comparison Target | Cosine Similarity (Cosine) | Mean Absolute Error (MAE) | Maximum Absolute Error (Max AE) | NaN / Inf Occurrences |
|---|---|---|---|---|
| PyTorch → ONNX | 0.9999994183 | 0.00012350 | 0.09396 | 0 / 0 |
| PyTorch → RKNN | 0.9999990896 | 0.00019535 | 0.11446 | 0 / 0 |
| ONNX → RKNN | 0.9999995474 | 0.00014175 | 0.06969 | 0 / 0 |
The cosine similarity between the baseline PyTorch output and the RKNN output was 0.9999990896. For a single block, the outputs before and after conversion maintained highly aligned trajectories.
Output Comparison Across 28 Blocks
To confirm that numerical errors do not amplify while passing from Block 0 through Block 27 across all 28 blocks, we compared the pure ONNX accumulated tensor against the RKNN 84-core accumulated tensor.
- Lowest single-block cosine similarity: 0.999993668 (lowest among all 28 blocks)
- Final hidden layer similarity (Hidden Cosine): 0.9999989412
- Final 16-channel prediction tensor similarity (Final Prediction Cosine): 0.9999989072
- Final prediction tensor MAE: 0.00129712
- Final prediction tensor Max AE: 0.00830078
- Boundary NaN / Inf occurrences: 0
Even after passing through 28 blocks, no NaNs or Infs occurred, and high similarity to the reference output was preserved. However, this numerical comparison must be distinguished from the perceptual quality evaluation of the final generated image.
4. How Long Did Denoising Take?
Pure NPU Latency by Branch Across Full 28-Block Forward Pass
On the RK3588 NPU, the total pure inference time for a single forward pass through all 28 DiT blocks is approximately 38.90 seconds. The branch-by-branch values below represent the summed execution times across all 28 blocks.
The detailed latency breakdown by core is as follows: – Self-Attention Core: 12.99 seconds – Cross-Attention Core: 3.92 seconds – FFN Core: 21.99 seconds
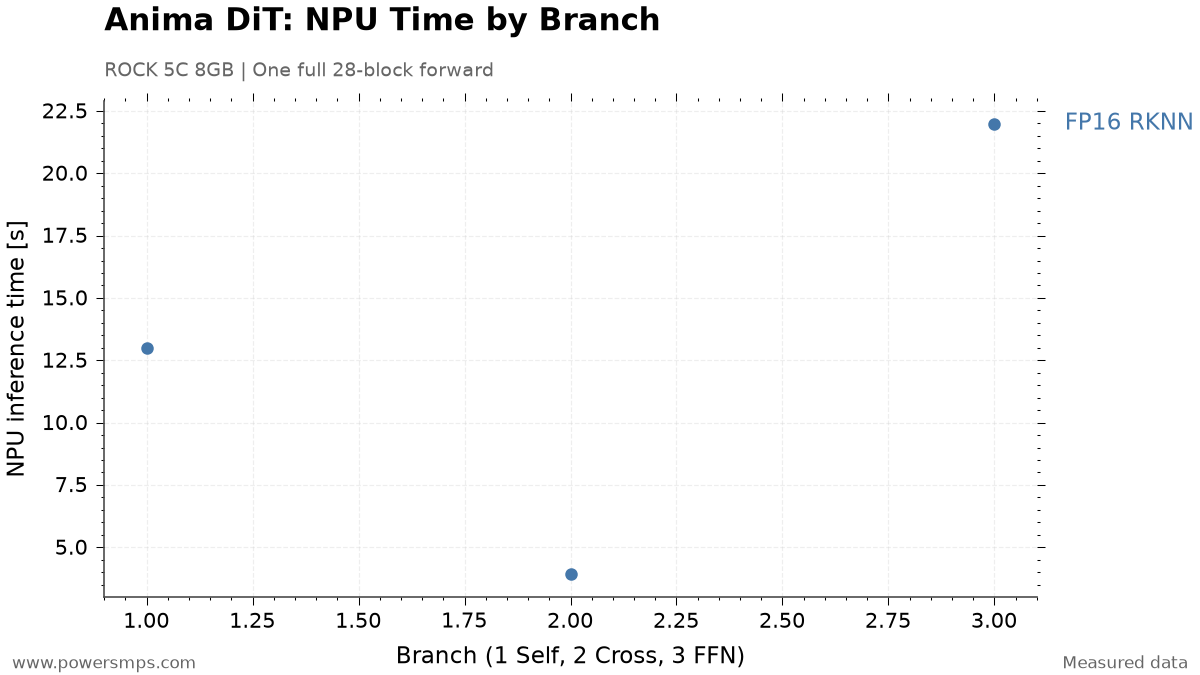
The parameter-heavy FFN core accounts for approximately 56.5% of total pure NPU inference time. Note that the total wall-clock time for the full 28-block test accompanied by ONNX numerical validation logic was 162.8 seconds, which is distinct from the pure NPU compute time (38.90 seconds).
20-Step Sequential CFG Denoising Results
We executed the actual image generation workflow—a 20-step sequential Classifier-Free Guidance (CFG, guidance scale 4.0) denoising process—directly on the board. Due to memory constraints, conditional (positive) and unconditional (negative) predictions were not batched together, but processed via sequential invocations.
- 20-step denoising: 2,408.54 seconds
- Per-step average: 120.40 seconds
- Pure NPU compute per step: 76.21 seconds
- Model staging, host processing, etc. per step: approx. 44.19 seconds
- NaN/Inf occurrences across all 20 steps: 0
The approximately 44.19 seconds of non-NPU overhead per step includes loading, initialization, and releasing (load/init/release) across the 84 RKNN models, as well as host computation and boundary marshalling costs. Subsequent optimizations will isolate and profile these components individually.
5. Reducing Image Reconstruction Time by Replacing the VAE
The VAE decoding process, which reconstructs the denoised latent representation into a 512×512 pixel RGB image, poses a heavy CPU compute burden. Using the official Diffusers Qwen-Image VAE FP32 CPU implementation as-is resulted in a decoding latency of 2,154.51 seconds (approx. 35 minutes 54 seconds), introducing a severe bottleneck on par with the total 20-step DiT denoising time.
For VAE decoding, we applied an ARM NEON- and OpenMP-optimized CPU implementation from stable-diffusion.cpp. Rather than re-initializing the text encoder and transformer, the pipeline was linked to receive only the post-denoised latent tensor and reconstruct the image.
Configured with 4 CPU threads, a tile size of 32×32, and an overlap of 0.5, the comparison results between VAE backends are as follows:
| Metric | Official Diffusers FP32 VAE | sd-cpp Tiled CPU VAE | Improvement |
|---|---|---|---|
| Decoding Latency | 2,154.51 seconds | 155.04 seconds | 13.90× faster (1,999.47 seconds saved) |
| PSNR (vs. Diffusers Output) | Baseline | 31.444 dB | Compared to reference |
| 11×11 Gaussian SSIM | 1.00000 | 0.96109 | Compared to reference |
| Output Resolution & Format | 512×512 RGB | 512×512 RGB | NaN / Inf: 0 |
Visual inspection confirmed that composition, color, and fine details were well preserved. While PSNR and SSIM do not imply identical outputs, decoding time was reduced to the 2 minutes 35 seconds range.
Total Latency: Denoising Plus Image Reconstruction
Integrating VAE acceleration yields the following overall image generation latency: – DiT 20-step sequential CFG denoising: 2,408.54 seconds – sd-cpp tiled VAE decoding: 155.04 seconds – Total generation time (excluding 1-time prompt encoding): 2,563.58 seconds (approx. 42 minutes 44 seconds)
6. The Next Bottleneck: Denoising
By reducing VAE decoding latency from 2,154.51 seconds to 155.04 seconds, the VAE’s share of overall pipeline latency dropped dramatically from 47.2% to 6.0%. Consequently, the dominant system bottleneck shifted to DiT 20-step denoising (2,408.54 seconds, 94.0% of the total).
Deconstructing DiT denoising internally shows that pure NPU compute takes 76.21 seconds per step (across 20 steps, totaling 1,524.20 seconds), while the remaining approximately 884.34 seconds consists of non-NPU overhead including model lifecycle and host processing. Context residency was considered as a candidate to eliminate repetitive initialization costs, but memory headroom and actual savings required independent verification under an 8GB environment. Those experimental results are covered in Part 3.
Subsequent optimizations examined compute iteration count alongside memory usage. Part 2 covers reducing compute steps with Spectrum, while Part 3 explores the limits of quantization and model residency against image quality and memory constraints. In Part 4, we evaluate compiler version differences and the trade-offs of graph operator fusion.
Leave a Reply